Batted Ball Distance Calculator Use Case and Predictive Modeling
By Ken Cherryhomes ©2025
Good Outcome vs. Optimal Outcome—Aaron Judge’s Double Under the Lens of Predictive Modeling
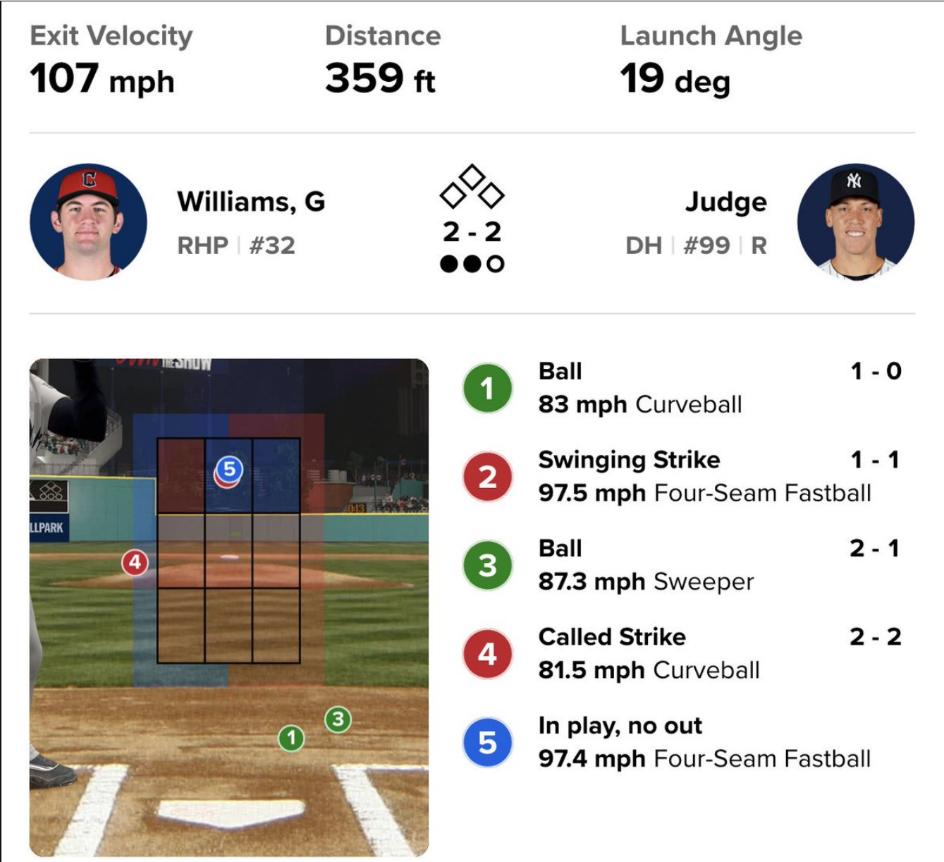
On April 21st, 2025, Aaron Judge turned around a 97.4 mph four-seam fastball and drove it 359 feet into left-center field. The ball left his bat at 107 mph with a 19° launch angle—loud contact, by any standard. Statcast called it a double. Broadcasters called it a success.
Most analysts stop there.
I don’t.
I don’t celebrate the result. I evaluate the collision.
I look at swing shape. I look at spray angles. I consider what happens when spray direction aligns or deviates with pitch location, average bat velocity, and potential exit velocities, and if everything matches that hitter’s projected optimal.
Because I don’t assess swings as good or bad, successful or unsuccessful. I assess whether the decision was efficient, whether the collision was aligned, and whether it’s repeatable under similar conditions.
That’s the difference between outcome-based thinking and probabilistic, structure-based evaluation.
Favorable outcomes can conceal underlying mechanical or timing flaws, leading hitters and coaches to mistakenly perceive such results as reliably repeatable. Consider a pulled line-drive double to dead left field: contact on a pulled ball occurs farther forward, later in the swing arc, where the barrel is naturally ascending, creating ideal conditions for elevation. A line drive in this scenario reveals a horizontal misalignment—indicating the batter swung around the ball rather than properly beneath it. And I wouldn’t need to see the swing in order to know this because in that scenario, I know how the ball should fly and where it should go. Statistically, this error more commonly produces a hard-hit ground ball to shortstop or third base, not a double. Despite appearing positive on the scorecard, this outcome is lucky rather than optimal.
This inherent uncertainty highlights the critical need in predictive modeling, such as the xFactor Predictive Modeling System I’ve designed. This system not only analyzes swing metrics—including launch angle, exit velocity, contact depth, and spray angle—but also weighs these outcomes by assigning predictive values to each decision the hitter makes based on historical data. By quantifying the relative worth of every swing decision, the system differentiates clearly between optimal execution and outcomes influenced by chance.
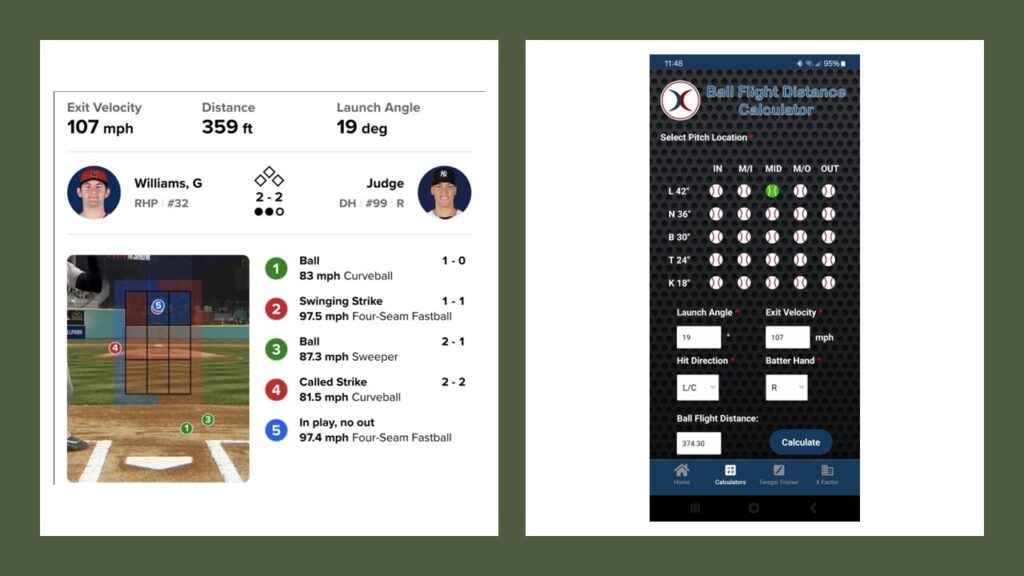
To precisely evaluate outcomes such as Judge’s, even without a predictive modeling system weighing outcome potentials, we can leverage the xFactor Ball Flight Distance Calculator, part of the X Factor Technology Free App Bundle. The Ball Flight Distance Calculator estimates projected distances based solely on launch angle, exit velocity, and batted-ball characteristics, controlling for environmental variables such as wind, temperature, and altitude. It assumes a neutral setting, comparable to playing in a domed stadium like Tropicana Field or the old Safeco Field in Seattle.
Because of this environmental control, the distances produced by the calculator may differ from actual on-field measurements. However, this allows for a qualitative comparison—isolating the effect of variables such as hit direction and contact depth—similar to how the predictive modeling system evaluates and weighs alternative outcomes structurally, without environmental noise.
Combining predictive modeling with exact batted-ball data, my system moves beyond merely acknowledging good outcomes and bucketing them as such, toward systematically identifying and maximizing each swing’s true potential.
This approach stems from a fundamental difference in how I view outcomes themselves: where many see success, like a hard-hit ball outcome being a matter of good luck or bad luck, I see deeper opportunities for optimization. This perspective is built into the architecture of the xFactor Predictive Modeling System, which challenges traditional assumptions by weighing not just what happened, but what could have happened based on underlying swing variables.
To illustrate this process, we will begin with a use case for the Ball Flight Distance Calculator by manually analyzing Judge’s double—an analog approach that mirrors how the predictive modeling system evaluates potential outcomes under controlled, neutral conditions.
Evaluating the Actual Outcome
The pitch Judge hit—a 97.4 mph four-seam fastball—was middle and elevated in the zone (42 inches vertical height, middle-horizontal). Using the Ball Flight Distance Calculator under neutral conditions (no environmental effects, comparable to a domed stadium):
- Judge’s actual outcome (Left-Center Field):
-
-
- Predicted Distance: 374 ft
- Actual Distance: 359 ft
- Result: Double
-
The calculation predicts slightly more carry, since wind, altitude and other environment factors are not considered, but the real-world distance closely aligns, verifying model accuracy.
Alternative Outcomes: Testing the Spray Angle
To assess whether Judge’s decision to pull this pitch was optimal, we explore two alternative swing orientations:
Alternative 1: Hit Straightaway to Center Field
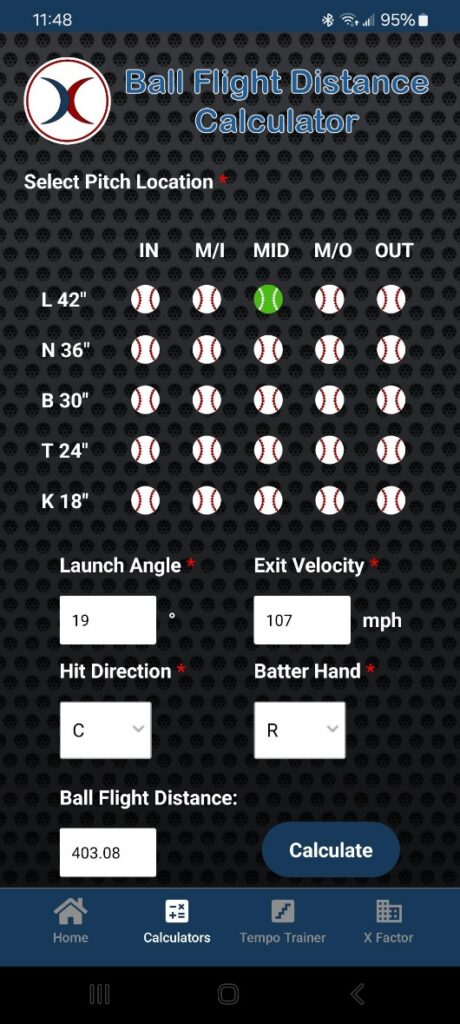
- Predicted Distance: 403 ft
- Result Potential: Likely a home run or extra-base hit
Alternative 2: Going with the Pitch (Opposite Field, Right-Center)
- Predicted Distance: Slightly shorter (~359.73 ft) based on spray-angle impact on flight
- Result Potential: Likely double or possible out depending on positioning
Modeling indicates hitting the pitch straightaway to center offered the maximum potential outcome—likely clearing the fences rather than settling for a double or potential out, depending on historical data.
Decision Valuation and Predictive Modeling
The xFactor Predictive Modeling System evaluates real-time swing decisions against potential alternative outcomes. By calculating the probability and value of each scenario, hitters and teams gain powerful, actionable insights. For Judge’s at-bat:
- Actual Decision (Pulled):
- Moderate probability of a base hit/double.
- Moderate probability of home run.
- Optimal Decision (Center):
- Significantly increased home run probability, enhancing outcome value.
- Opposite-Field Decision:
- Lower outcome potential with increased risk.
Given these metrics, Judge’s actual outcome—while beneficial—was suboptimal according to predictive analytics. The pitch’s location and velocity profile indicate Judge had an optimal home-run opportunity straightaway.
Shifting the Narrative from Good to Optimal
Aaron Judge produced a very good result, but analytics demonstrate a better outcome was realistically within reach carrying a potentially higher outcome possibility. The xFactor Predictive Modeling System and even the free xFactor Ball Flight Distance Calculator provide hitters with a lens through which each decision can be evaluated, trained, and optimized, ensuring future scenarios yield the highest possible returns.
In the era of precision-guided hitting, the distinction between “good” and “optimal” outcomes could mean the difference in the larger picture for swing decisions and approaches. Leveraging predictive models and analytical calculators like those provided by X Factor Technology empowers hitters not just to make good contact—but to maximize every opportunity.