

A 2026 All-Star Break Collision-Level Analysis of Five Elite MLB Hitters
By Ken Cherryhomes and Stacy Silvernail ©2026
Preface
A few weeks ago, I wrote an article detailing the collision-level reasoning behind Fernando Tatis Jr.’s power suppression at the 40-game mark of his season. Article – Fernando Tatis Jr.’s Power Outage – X Factor Technology The analysis pointed to poor power conversion in the Power Band, driven by deep contact-point targeting and opposite-field spray behavior on pitches that should have produced pull-side damage.
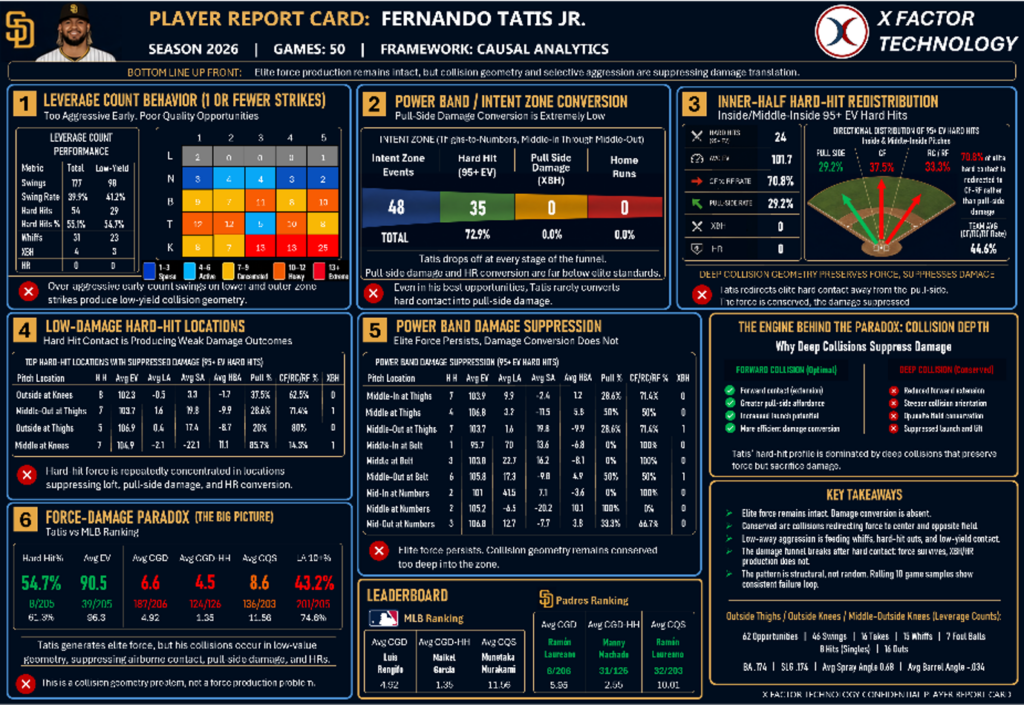
Some of those behaviors have changed by the 2026 All-Star Break. Tatis Jr. is now pulling more pitches across the zone, but the flight profile has not changed enough to unlock the expected damage. That’s because his broadened arc in the Power Band is creating more pull-side direction, while his deep collision-point targeting remains in effect. Basically, he’s broadening to pull the ball, but his forward barrel extension is suppressed. Instead of extending the swing forward, he is turning the barrel over to maintain deep collision points. The result is continued low launch angles and continued power suppression, even while he sits atop the leaderboard in hard-hit frequency.
This paper expands the analysis beyond Tatis Jr. to test whether offensive value is better explained by visible swing mechanics or by pitch selection, collision geometry, and damage conversion.
The purpose here is not to compare swing appearances. The purpose is to offer an alternative modeling perspective. Instead of asking whether hitters should replicate another hitter’s swing, this paper asks whether value is better created by changing swing decisions, collision geometry, and collision-depth targeting in ways that match specific pitch locations.
Why swing-template modeling misses the value created by pitch selection, collision geometry, and damage conversion
The Evaluation Chain
How the swing arrives stylistically is only relevant to the extent that it delivers the barrel to the baseball. Once contact occurs, the result is governed by the collision itself: barrel speed, contact location, barrel angle, spray angle, launch angle, and the quality of the ball flight that follows. A swing can look efficient and still produce a poor collision. It can also look unconventional and still produce damage if the collision conditions are right.
Therefore, the evaluation chain we are using is:
Pitch location → swing decision → barrel angle → spray angle → batted-ball type → outcome
This chain gives the evaluation a fixed order. It begins with the pitch the hitter chose to attack and ends with the value created by the collision. Pitch locations, spray directions, and pull, middle, and opposite-field classifications are normalized to the hitter’s batting side, including separate handedness treatment for switch hitters. Exit velocity is part of that evaluation, but it is not the evaluation by itself. The same applies to launch angle. Neither matters unless it helps produce damage.
This paper examines five MLB hitters at the 2026 All-Star Break: Yordan Alvarez, Fernando Tatis Jr., Kyle Schwarber, Shohei Ohtani, and Otto Lopez. The purpose is to test whether offensive value is better explained by mechanical swing modeling or by the collision-level data that shows how force becomes damage.
The current development model starts with elite swing mechanics. A hitter like Alvarez, the MLB leader in slugging, on-base percentage, and OPS, is the kind of player organizations naturally want to study because he’s not just a power hitter. He combines impact, strike-zone control, damage conversion, and broad-field production. He’s a hitter who hits for both elite power and high batting average. That makes him the kind of hitter people look at and ask whether others should be modeled after him.
Schwarber, the league’s top home run hitter, belongs in the analysis for a different reason. He’s not the template hitter. He’s a one-dimensional power hitter with a more specialized profile. His power is elite, but it comes with tradeoffs. That makes him useful as a contrast, not as the model. Schwarber shows what a narrower power profile looks like when the hitter sells out for damage.
Ohtani and Lopez add two more contrasts. Ohtani, the reigning NL MVP, gives the analysis another elite-power profile with a different decision pattern. Lopez, the MLB leader in batting average, gives the analysis a contact-oriented hitter whose value isn’t built around slugging.
Tatis Jr. is the test case because his raw impact is already elite. He’s second in MLB with 153 hard-hit events, yet that force isn’t converting into enough damage. If the force is already present, then the missing value isn’t simply a mechanical power problem. The issue becomes damage conversion. The analysis has to ask where the value is being lost after the ball is struck hard.
The starting question for this paper is, should a hitter like Tatis Jr. be moved mechanically toward an Alvarez-style balanced elite template, a Schwarber-style power template, an Ohtani-style power profile, or a Lopez-style contact model? Or does the data point to a different answer?
That shifts the model away from swing-template copying, toward collision-level evaluation. The useful variables are pitch location, swing decision, contact depth, barrel angle, spray angle, batted-ball type, launch profile, and total-base return. Those variables explain whether (and how) elite force becomes offensive value.
Together, the five hitters show why one mechanical template can’t explain offensive value across different hitter types. The central question is not whether every hitter should look like Alvarez, Schwarber, Ohtani, or Lopez. It is whether the data supports mechanical imitation at all, when the better explanation may be swing decisions and collision geometry. Alvarez, Schwarber, Ohtani, and Lopez are valuable reference points because they show different ways offensive value can be created. Tatis Jr. is valuable as the test case because his data shows that elite force can still be suppressed by swing decisions, collision geometry, and collision-depth targeting that don’t turn force into total bases.
Yordan Alvarez and the Elite Hitter Standard
The standard practice in coaching and player development is to analyze elite hitters and treat their mechanics as the explanation for their success. When a hitter produces at an elite level, baseball studies the body sequence, barrel path, and movement signature, then uses those visible mechanics as a reference or template for other hitters.
That’s why Yordan Alvarez matters here. He is the kind of hitter baseball naturally studies because he combines a balance of elite power, high average, strike-zone control, and total-base production.
This paper takes a different view. Alvarez should not be the standard because of his mechanics. He should be the standard because his data shows how his swing decisions align more often with pitch locations that create damage opportunities, and how barrel angle, spray angle, launch profile, and contact direction commensurate with those pitches turn those opportunities into damage.
A mechanical model asks whether another hitter can move more like Alvarez. A collision model asks whether another hitter can create the same value-producing conditions without copying Alvarez’s mechanics.
The Tatis Jr. Problem
Tatis Jr. is the clean test case because the raw power is already present. He produces elite exit velocity, so the data does not point first to a force-generation problem.
The problem is value conversion. Tatis Jr. hits the ball hard, but that force is not turning into enough damage. The evaluation should therefore move away from mechanical reconstruction and toward the variables that control the collision result: pitch selection, swing decision, contact depth targeting, barrel angle, spray angle, launch angle, batted-ball type, and total-base return. In other words, how can Tatis Jr. take his swing and convert it into elite damage conversion.
The first place to test that value-conversion problem is pitch selection. If a hitter is wasting too many swings in locations where damage is unlikely, elite exit velocity becomes less useful. That’s why swings in the Low Damage Zone matters.
Low Damage Zone Test
The Low Damage Zone is defined here as the outside-knee pitch, the outside-thigh pitch, and the middle-outside knee pitch. In the 25-zone grid, those are K5, T5, and K4. These are pitcher-friendly locations because they do not naturally provide most hitters with the collision geometry needed for damage. The pitch location pushes the hitter toward deeper contact points, weaker launch, reduced pull-side damage, or a contact-only outcome.
That’s meaningful because the evaluation chain is not just exit velocity and launch angle without context. The Low Damage Zone is the first test of whether hitters are choosing pitches that allow the collision to become damage.
The first cut is the all-count terminal outcome test. This includes every plate appearance that ended in the Low Damage Zone, regardless of count. That means it includes normal swing decisions, two-strike survival swings, and strikeouts resulting from a swing. It is not yet a clean swing-decision test. It is the baseline value test: when the plate appearance ended from a swing in the Low Damage Zone, what value did the hitter get?
Low Damage Zone, Terminal At-Bat Outcomes, All Counts
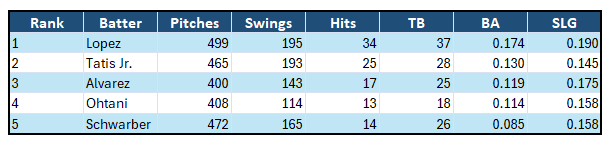
Otto Lopez has the highest batting average on all Low Damage Zone swings at .174, and that number defines the zone. The best average in the group is a bad average. Lopez produced a hit on fewer than one of every five swings in this zone, and his .190 slugging percentage shows that even the best overall return is mostly contact value. The Low Damage Zone can produce some hits. It does not produce much damage.
Alvarez has the highest slugging percentage in MLB, but for this zone, his SLG percentage is only .175. That is terrible. Alvarez is the best force-to-damage hitter in this examination, and even he does not make this location group productive. That matters because it shows the weakness is not hitter-specific. The zone itself suppresses value.
Tatis Jr. makes the swing-volume problem clear. He took 193 LDZ swings and produced 25 hits for 28 total bases. That is a .130 average and a .145 slugging percentage from a hitter with elite raw impact. The force is not the issue. The location is turning that force into low-value contact.
Ohtani raises a different question. He produced a .114 average and .158 slugging in the Low Damage Zone, so the area is clearly weak for him. But he also had the fewest LDZ terminal swings in the group by a large gap. That does not make the zone less important. It makes the pitcher-usage question more obvious. If this is such a low-return area for Ohtani, why are more at-bats not being finished there?
Schwarber completes the same picture from the power side. He produced a .085 average and a .158 slugging percentage in the Low Damage Zone. That is a dead-zone return for a hitter whose offensive value depends on damage. Like Ohtani, the zone does not give him the collision conditions needed to turn force into total bases.
The all-count terminal sample establishes the baseline: the Low Damage Zone is a bad place to spend swings. Across five different hitter types, the best batting-average return is poor, the best slugging return is terrible, and the total-base value is limited. That is why the next cut has to isolate leverage counts. If the zone is this weak across all counts, then swinging at it before two strikes becomes the real decision problem.
Leverage Counts Change the Question
All-count terminal data is useful, but it does not fully test decision quality because it mixes normal swing decisions with two-strike survival behavior. With two strikes, hitters are forced to protect the plate, expand the zone, adjust the swing, or fight off pitches they would not choose to attack earlier in the count.
That’s why the leverage-count test matters. By isolating swings with zero or one strike, the analysis focuses on decisions made before survival mode. This is where the hitter still has freedom to take low-value pitches and wait for a better damage opportunity.
In this view, every swing at K5, T5, or K4 with zero or one strike is charged. Fouls, swings and misses, balls in play, hits, and outs all remain in the denominator. This gives the decision test a cleaner denominator because it asks what each hitter produced from the swings he chose to spend in the Low Damage Zone before he was forced to protect.
Low Damage Zone, Leverage Count Performance, (0 to 1 Strikes)
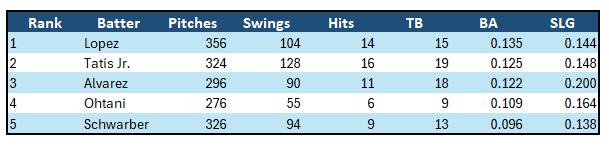
Once every leverage-count swing is charged, the Low Damage Zone is exposed as a weak swing target. Lopez still leads in average per swing, but .135 is not strong. It means he handles the zone better than the others, not that the zone produces damage. Alvarez has the strongest damage return at .200 slugging per swing, which fits the broader point of the paper: his value comes from converting force into damage more efficiently, even in locations that work against the hitter.
Tatis Jr. is second in average per swing, but the damage return is limited. The larger problem is swing volume. He did not merely produce limited damage from the Low Damage Zone. He attacked it more than anyone else in the group, with 128 leverage-count swings and a 39.5% swing rate. The contrast is sharpest against Ohtani, who swung only 55 times at a 19.9% rate, and Alvarez, who produced the best slugging return while taking 38 fewer swings than Tatis Jr.
The geometry explains why this matters. The Low Damage Zone does not just reduce outcome value after the fact. It changes the collision conditions available to the hitter.
Low Damage Zone, Leverage Count Collision Geometry

Tatis Jr. had the most LDZ contacts in the group, with 51, but his average launch angle was -5.65°. That is the key geometry problem. The swing volume created contact, but the contact did not produce damage loft.
Alvarez handled the same zone better, with a 21.70° average launch angle and the best LDZ damage signal in the group. Lopez created contact value, but his -14.12° average launch angle and 74.6 mph average exit velocity explain why the value stayed mostly single-base.
Ohtani produced better ball-flight geometry than Tatis Jr. and Lopez, with a 10.90° average launch angle and 85.7 mph average exit velocity, but he had only 20 contacts and 1 damage event. Schwarber produced more lift, with a 15° average launch angle and the strongest pull-side contact count in the group, but he still produced only 2 damage events on 24 contacts. Both hitters showed some usable contact geometry, but the Low Damage Zone still did not give either one a repeatable damage path.
LDZ Extra-Base Hits by Spray Direction
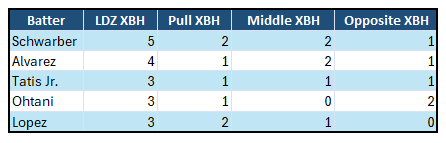
The extra-base-hit distribution shows whether the LDZ geometry actually became damage. The answer is limited across the group. Schwarber produced the most LDZ extra-base hits with five, spread across pull, middle, and opposite field. Alvarez produced four, with two to center, one pulled, and one hit to the opposite field. Tatis Jr., Ohtani, and Lopez each produced only three.
Tatis Jr.’s three LDZ extra-base hits were scattered: one pull, one up the middle, and one to the opposite field. That is not a repeatable damage pattern, especially from the hitter with the most LDZ contacts and the most leverage-count LDZ swings in the group. Ohtani’s three extra-base hits leaned toward the correct outside-pitch direction, with two opposite-field XBH. Lopez produced contact value, not damage value. Schwarber’s raw power created five extra-base hits, but the broader leverage-count return still does not justify hunting the zone before two strikes.
The LDZ finding is that the correct spray geometry still carries a lower damage ceiling. Correct does not mean high-value. A hitter can solve the pitch correctly and still receive limited damage because the location itself suppresses the return.
K5, The Down-Away Pitch
The next cut isolates K5, the down-away knee pitch. This includes swings at K5 pitches in and out of the strike zone. K5 is the cleanest Low Damage Zone decision test because it is the least hitter-friendly location in the strike zone. Pitchers know this. It is often treated as a safe place to start an at-bat with a strike because the hitter can put the ball in play and still produce weak value.
Like the LDZ, but more narrowly, the correct spray direction is opposite field, but the expected return is limited. The hitter can solve the pitch correctly and still get lower-value contact because the location naturally suppresses power. It pushes the hitter away from pull-side damage, toward deeper contact, lower exit value, and a smaller damage window. That makes K5 a good pitch for the pitcher and a poor early-count swing target for the hitter.
K5 Leverage Count Swing Rates, High to Low
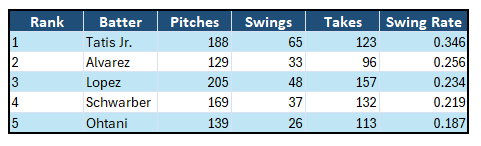
Tatis Jr. is the clear K5 swing-rate outlier. He swung at 34.6% of K5 leverage-count pitches, compared with 25.6% for Alvarez, 23.4% for Lopez, 21.9% for Schwarber, and 18.7% for Ohtani. The gap matters because K5 is the least hitter-friendly location in the strike zone and requires opposite-field geometry that already lowers the damage ceiling.
Alvarez and Lopez attacked the pitch at similar rates in the middle of the group, while Schwarber was slightly more selective. Ohtani showed the best discipline, swinging at fewer than one of every five K5 leverage-count pitches. Tatis Jr., however, chose to spend leverage-count swings in this low-return location far more often than any of the other hitters.
However, swing rate alone does not prove the decision is wrong. The collision result does.
K5 Down-Away Leverage Swing Performance Outcomes

In leverage counts, Tatis Jr. accepted the pitcher’s terms more often than any of the hitters in our sample. He chose to swing at K5 65 times, and while his .138 batting average was the highest in the group, all 9 hits were singles. His .138 slugging percentage confirms that the best batting-average return in the sample produced no extra-base damage.
That is the cost of the decision. Tatis Jr. turned leverage counts into survival outcomes when survival was not required. Instead of taking the least hitter-friendly pitch in the strike zone and waiting for a location with greater damage potential, he accepted the contact outcome the pitcher was trying to create.
Lopez followed the same low-value pattern. He produced 6 hits on 48 swings, all singles, for a .125 batting average and .125 slugging percentage. The contact was playable, but it did not justify choosing K5 as an early-count swing target.
Alvarez was the only hitter who created extra-base damage from K5. His .121 batting average was lower than Tatis Jr. and Lopez, but his .212 slugging percentage led the group because his 4 hits produced 7 total bases. Even Alvarez’s return, the best damage result in the sample, remained limited for a pitch the hitter did not have to attack.
Ohtani showed the best discipline in the group. He swung at K5 only 26 times in leverage counts, the lowest total and lowest swing rate in the sample. His .077 batting average and .077 slugging percentage show how poor the return was when he did swing, but his lower volume also shows that he avoided accepting the pitcher’s terms more often than the others.
Schwarber produced a .054 batting average and .054 slugging percentage. That is the weakest return in the group and exactly the kind of outcome pitchers are trying to create when they use K5 to get ahead.
The table shows why K5 is such a poor leverage-count swing target. The hitter can make contact and even collect a hit, but the location rarely returns damage. In counts where the hitter can take the pitch and wait for a better damage opportunity, swinging at K5 means accepting the pitcher’s preferred outcome.
K5 Leverage Count Collision Geometry

The geometry exposes what those K5 contacts became. Tatis Jr.’s average launch angle was -13.74°, with a 76.9 mph average exit velocity and zero damage events. The issue is not whether he could make contact. The issue is that the contact did not produce damage flight.
The spray-direction split matters just as much. Of his 23 K5 contacts, 10 were pulled, 6 went through the middle, and 7 went to the opposite field. Opposite field is the correct spray direction for K5. Pulling the pitch does not match the location’s natural geometry, while even the correctly directed contact still carries a lower damage ceiling because the pitch is down and away.
Lopez produced contact without damage. His average launch angle was -23.13°, his average exit velocity was 69.7 mph, and none of his 15 contacts became a damage event. Most of that contact stayed through the middle or opposite field, which fit the location better, but the ball flight remained too weak to create value.
Alvarez was the only hitter to create a damage event. His average launch angle was 16.63°, his average exit velocity was 86.9 mph, and 7 of his 8 contacts went through the middle or opposite field. His return came from matching the pitch location with better geometry, not from higher volume.
Ohtani also produced 8 contacts, with a 12.63° average launch angle and 86.5 mph average exit velocity, but none became damage. Schwarber produced the most lift at 25°, but 3 of his 5 contacts were pulled and none became damage.
Across the group, the geometry both explains and exposes the weak K5 return. It explains why the outcomes were poor, and it exposes the specific collision patterns behind them: too much pulled contact for the location, low launch on the correctly directed contact, and almost no damage conversion. Alvarez was the only exception, and even his return came from a very small sample. K5 remains a poor leverage-count swing target.
K5 Leverage Count Contact Results by Spray Direction
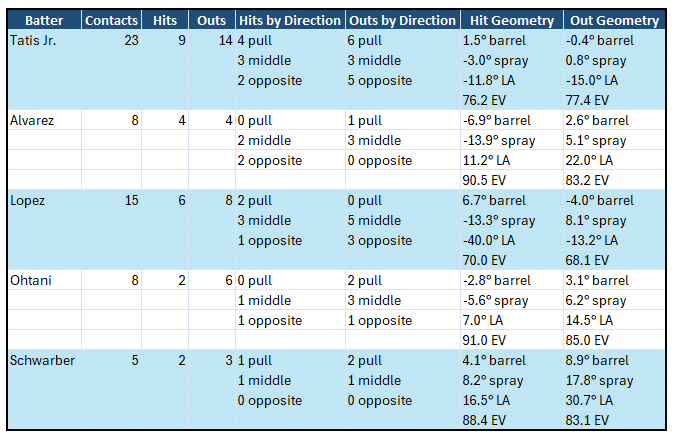
The contact-result split shows what the K5 collision geometry produced. Tatis Jr.’s 9 hits included 4 pulled, 3 through the middle, and 2 to the opposite field. His hit geometry averaged a 1.5° barrel angle and -3° spray angle, producing a -11.8° launch angle, 76.2 mph average exit velocity, and no damage events.
His 14 outs included 6 pulled, 3 through the middle, and 5 to the opposite field. Those outs came from a -0.4° barrel angle and 0.8° spray angle, producing a -15° launch angle and 77.4 mph average exit velocity.
Alvarez created the best K5 return. His 4 hits went entirely through the middle and to the opposite field. A -6.9° barrel angle and -13.9° spray angle produced an 11.2° launch angle, 90.5 mph average exit velocity, and the only damage event in the group.
Lopez’s hit geometry averaged a 6.7° barrel angle and -13.3° spray angle, producing a -40° launch angle and 70 mph average exit velocity. Ohtani’s -2.8° barrel angle and -5.6° spray angle produced a 7° launch angle and 91 mph average exit velocity, but only 2 hits and no damage. Schwarber’s 4.1° barrel angle and 8.2° spray angle produced a 16.5° launch angle and 88.4 mph average exit velocity, but his contact leaned away from the correct opposite-field direction and produced no damage.
The data suggests K5 is not bad because opposite-field contact is wrong. K5 is a poor leverage-count target because even correctly directed collision geometry carries a lower damage ceiling. Across the group, Alvarez was the only hitter who converted K5 geometry into damage, while Ohtani showed the best discipline by attacking the location least often.
Power Band, or “Intent Zone”
The Low Damage Zone shows where swings lose value, while the Power Band, or “Intent Zone,” shows where swings naturally convert into damage. The pitch is high enough and central enough for the hitter to swing with damage intent, where they can intentionally broaden their swing arc to create forward contact, driving the ball to the pull side.
This is not a protect swing or a contact-survival swing. It is the part of the zone where the hitter is hunting pitches to apply damage.
For this analysis, the Power Band includes the belt, number, and thigh locations through the middle-in, middle, and middle-out columns. In the 25-zone grid, that is B2 through B4, N2 through N4, and T2 through T4.
These locations allow the analysis to compare how each hitter uses swing arc, collision depth, direction, and launch geometry when the pitch provides a genuine damage opportunity.
Power Band, Terminal At-Bat Outcomes, All Counts
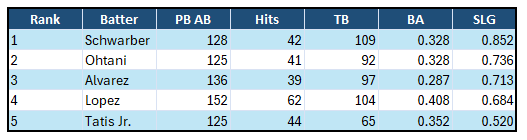
The Power Band table shows why exit velocity alone cannot explain damage. Tatis Jr. hit .352 in the Intent Zone, the second-highest batting average in the group. That is not a contact failure. He produced 44 hits in the same corridor where damage should be created.
The problem is slugging. His .520 slugging percentage is the lowest in the group. Schwarber slugged .852, Ohtani .736, Alvarez .713, and Lopez .684.
That is the first major warning sign. Tatis Jr. produced more Power Band hits than Schwarber, Ohtani, and Alvarez, but those hits created only 65 total bases. The contact was present. The damage was not. For a hitter with elite hard-hit ability, that is not a force problem. It’s a conversion problem.
Power Band Contact and Damage Indicators

The Power Band contact data shows five different collision profiles producing five different damage returns. Tatis Jr.’s average barrel angle was -2.3°, his average spray angle was 4.5°, and his average launch angle was 13.1°. For a right-handed hitter, that positive spray angle reflects an opposite-field lean, which matches the 39.3% of his Power Band contact directed the other way compared with 32.1% to the pull side. His 13.1° average launch angle produces a low line-drive flight profile. That can produce hard contact and hits, but it does not consistently create the driven fly-ball flight needed to maximize power in the part of the strike zone where power should flourish.
Schwarber shows the opposite extreme. As a left-handed hitter, his 14.6° spray angle reflects a strong pull-side direction, matching his 61.9% pull-contact rate. His 28.9° average launch angle produces a lofted fly-ball profile, and he converted that geometry into 20 pull-side damage events. His Power Band success is not simply the result of hitting the ball hard. His contact is being launched at a home-run-producing angle and directed overwhelmingly into his pull-side damage lane.
Alvarez shows the balanced elite version. As a left-handed hitter, his nearly neutral -0.8° spray angle matches a contact distribution spread almost evenly across pull, middle, and opposite field. His 23.9° average launch angle produces driven fly balls and high line drives, giving him damage flight without requiring Schwarber’s extreme pull bias. He produced 11 pull-side and 9 middle-field damage events because his balanced direction was paired with launch geometry that still created total-base value.
Ohtani’s left-handed profile is more pull-directed than Alvarez’s but less extreme than Schwarber’s. His 6.3° spray angle, 47.2% pull-contact rate, and 17.0° average launch angle produce a line-drive to low-fly-ball profile. That geometry supported 10 pull-side and 8 middle-field damage events, showing that his Power Band contact was directed more consistently into productive damage lanes than Tatis Jr.’s.
Lopez is a switch hitter, so his aggregate 4.0° spray angle cannot be interpreted through one fixed handedness without separating his right-handed and left-handed plate appearances or normalizing spray angle by batter side. His directional distribution is more informative in the combined sample. He sent 34.0% of his Power Band contact to the pull side, 27.9% through the middle, and 38.1% to the opposite field. His 14.7° average launch angle produced a line-drive profile rather than a true power-fly-ball profile, which fits his more contact-oriented offensive identity. Even so, his damage remained broadly distributed, with 9 pull-side, 8 middle-field, and 6 opposite-field damage events.
Compared with the other four hitters, Tatis Jr.’s Power Band contact remained too deep, too flat, and too frequently directed toward the opposite field. His force was present, but the geometry did not consistently send that force through the primary pull-side and middle-field damage lanes.
Conclusion
The five hitters support a development model based on swing decisions and collision geometry rather than mechanical imitation. Their offensive differences are better explained by the pitches they attack, where they create collision, how they direct the ball, and whether those collisions become total-base value.
A mechanical model asks how another hitter can move more like Alvarez. A collision model asks how another hitter can create the same value-producing conditions with his own swing.
The hard-hit rankings reinforce that distinction. At the 2026 All-Star break, Tatis Jr., Alvarez ranked 2nd and 3rd in MLB in total hard hits, with Lopez at 11th, and Ohtani ranked 23rd despite using different mechanical plans. Schwarber ranked 59th while leading MLB in home runs. These hitters already generate sufficient force at an elite level. Their mechanics are doing the essential job of delivering the barrel to the baseball with impact. The meaningful differences appear in where that force is applied and what the resulting collision becomes.
That’s why changing swing path or focusing on attack angle in isolation has limited value. Attack angle is not a universal setting applied independently of pitch location. On pitches through the Power Band, especially inside pitches, forward collision occurs where the swing is naturally ascending. The attack angle emerges from collision depth and from where contact occurs within the arc.
For Tatis Jr., simply broadening the swing arc or trying to reproduce Schwarber’s attack angle would not solve the underlying problem. If he continues targeting deep collision points, the barrel will still turn over before sufficient forward extension occurs, suppressing launch and damage even when the ball is pulled. The required change is collision-depth targeting that allows Power Band pitches to be contacted farther forward, where the broadened arc culminates at a forward collision point and produces the ascending barrel path, spray direction, and launch conditions associated with damage.
The separation appears before and through the collision. Pitch location creates the opportunity or constraint. The swing decision accepts or rejects it. The swing arc, barrel angle, spray angle, launch profile, and direction determine whether the contact becomes an out, a single, or damage. Mechanics deliver the barrel, but geometry explains what that delivery produced against a specific pitch.
The Low Damage Zone and Power Band show opposite sides of the same model. One identifies locations where early-count swings accept restricted damage conditions. The other identifies locations where collision depth, launch, and direction can convert force into pull-side and middle-field damage.
Tatis Jr. provides the clearest test in this analysis. His force production is already elite. His missing value is not found in a lack of bat speed or hard contact. It is found in swings spent in low-return locations and in collision-depth targeting that prevents enough Power Band contact from becoming pull-side and middle-field damage.
The better template is therefore not another hitter’s mechanics. It is the relationship between pitch location, swing decision, swing arc, collision depth, barrel angle, spray angle, launch profile, direction, and outcome. That model does not ask the hitter to become someone else or alter variables that are already producing elite force. It identifies the decisions and collision conditions through which his existing swing can create greater offensive value.