Introduction to Causal Analytics, CGD and CGD+
By Ken Cherryhomes and Stacy Silvernail ©2025
Abstract
Modern baseball analytics rely on descriptive metrics such as xwOBA and BABIP to quantify offensive productivity. These models evaluate hitting events based on output variables like exit velocity (EV) and launch angle (LA). However, these metrics describe effects rather than causes. Consequently, descriptive models cannot quantify whether a hitter achieved the correct geometric solution. This research introduces Causal Analytics to evaluate the geometric inputs of a collision. The central metric is Collision Geometry Deviation (CGD). This metric explicitly excludes EV and LA because they do not speak to the directional intent relative to the pitch location. An aligned swing can still produce high velocity. A perfect geometric decision can result in an out.
The methodology utilizes a spatial swing map to define deterministic optimal collision depth and barrel orientation for twenty-five pitch zones. A middle pitch neutral barrel orientation serves as the reference anchor. CGD measures the weighted Euclidean distance between observed and expected geometry. By isolating depth and orientation, the metric evaluates the specific directional intent required for each zone.
Preliminary analysis separates geometric precision from variance. It contextualizes Hard-Hit Rate, proving extreme velocity on incorrect vectors creates predictable failure, not misfortune. Furthermore, this resolves standard BABIP assumptions by proving that much of what is currently labeled luck is actually quantifiable geometric error/obedience. This causal clarity enables a more powerful regression for predictive analytics. By translating mechanical reality into computational geometry, Causal Analytics isn’t just adding new stats; it is fixing a structurally incomplete way of thinking
Introduction
Modern baseball analytics faces a fundamental asymmetry. While pitch location is defined by a rigid and universal coordinate system known as the strike zone, the hitter’s response to that pitch is currently measured only by its chaotic aftermath. We track the flight of the ball using metrics like EV and LA, but we possess no standardized reference frame for the collision itself. We know where the ball went, but we lack a quantitative standard for where it should have been met. You cannot determine the geometric difference between two swings by averaging the history of their outcomes.
To resolve this, we introduce a standardized spatial swing map as the causal baseline. This framework establishes a deterministic optimal collision point for every definable location in the strike zone for the swing’s arc. The keystone of the system is the middle-pitch contacted at the barrel’s parallel window. This location defines the reference depth (D₀) and reference orientation (θ₀). All other collision points emerge from this anchor, which correspond with pitch locations and their commensurate spray directions, creating a universal frame for collision depth across the strike zone.
The primary instrument of this system is Collision Geometry Deviation (CGD). CGD is a spatial analytic that measures the Euclidean distance between the hitter’s actual contact geometry and the optimal solution dictated by the pitch. It calculates the difference between expected and observed values across two variables:
- Collision Depth (D). The spatial location of contact relative to the optimal depth for that specific zone, defined relative to the system’s standardized hitter-centric reference frame and keystone orientation.
- Barrel Orientation (θ). The angle of the barrel relative to the directional intent required to produce the commensurate spray direction for that specific pitch location, where expected barrel orientation is defined as the reflected half-angle of the expected spray direction (2:1 spray-to-barrel relationship).
- Collision Depth (D). The spatial location of contact relative to the optimal depth for that specific zone, defined relative to the system’s standardized hitter-centric reference frame and keystone orientation.
The formula normalizes these variables into a single execution score:
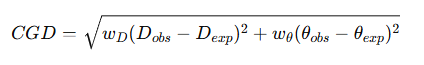
The weights wD and wθ normalize depth and orientation into a common scale. A low CGD indicates the hitter reached the correct portion of the arc for that pitch. A high CGD indicates the hitter compensated, adjusted, or mistimed the collision point relative to the optimal spatial solution. Unlike descriptive metrics, CGD does not measure outcomes. It measures whether the hitter matched the causal geometry dictated by the pitch.
CGD+ (Collision Geometry Deviation Plus)
CGD+ is an augmented execution metric that extends CGD by including strikeouts as penalty events. While CGD evaluates only collision geometry on balls put into play, CGD+ incorporates non-collision plate appearances by assigning a fixed penalty to strikeouts, allowing comparison between hitters with materially different contact rates and preserving CGD as the measure of collision execution quality while reflecting the total execution cost of missed collision opportunities.
Walks are not included because they contain no swing or collision attempt and therefore provide no geometric information about execution. Unlike strikeouts, which represent a failed attempt to solve the collision problem, walks are a decision outcome, not an execution outcome, and including them would conflate plate discipline with swing geometry.
Thesis: The Case for Causal Analytics
This study responds to a fundamental inefficiency in modern baseball science. While the industry possesses capture technologies capable of extreme granularity, the application of this data for hitting remains structurally immature compared to its pitching counterpart. Current hitting analytics rely almost exclusively on the aggregation of outcome data to perform historical evaluation. This approach limits the field to descriptive analytics, which can only predict future performance based on the assumption that historical trends remain static. It describes what happened, but it lacks the mechanistic resolution to explain why it happened or how to prescribe change.
This stands in sharp contrast to pitching analytics, which utilize the exact same optical tracking technologies to engineer performance. Pitching analysis does not merely track ERA or strikeout rates; it isolates the causal inputs of the delivery, such as release point consistency, spin axis efficiency, and seam orientation. It uses the technology to shape the pitch, not just grade the result.
Batting analytics are woefully behind this standard. The industry attempts to evaluate swings using orientation metrics such as Vertical Bat Angle (VBA) and Attack Angle (AA), or output metrics like EV and LA, but it applies them without geometric context. A specific AA, for example, cannot be evaluated as optimal or suboptimal in a vacuum; it is only functional relative to the specifics of the collision point. By stripping these metrics of their spatial context and aggregating them into season-long averages, current methods destroy the causal signal required for true optimization.
Therefore, this study asserts that the next evolution of hitting science requires a transition from Descriptive Analytics alone to include Causal Analytics. We propose that by establishing a universal reference frame (see Appendix) and measuring the geometric precision of the collision itself (CGD) we can bridge the gap between capture capability and analytical utility. This shift moves the paradigm from predicting performance based on luck-influenced outcomes to prescribing performance based on repeatable, physics-based execution.
What Hard-Hit Extremes Reveal
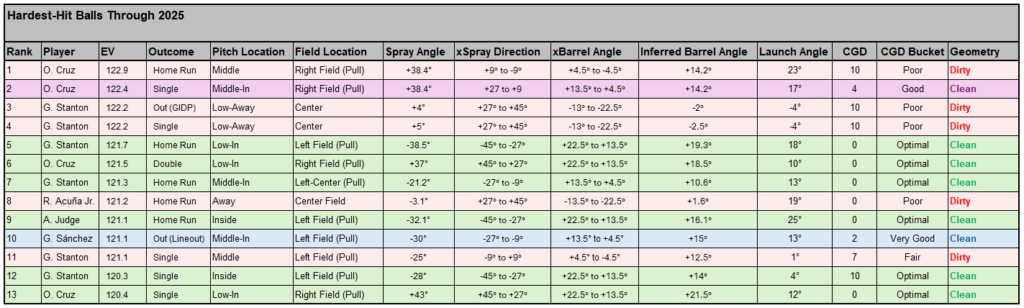
We can look at the hardest-hit balls in the Statcast era to separate exit velocity from collision geometry.
Many of these balls were hit with clean geometric decisions. They cluster on inner-third pitch locations driven to a pull field, where the barrel meets the pitch later in the swing arc and barrel velocity is at its peak. These extremes are not a random collection of hard contact. They are concentrated in a collision context that naturally produces elite exit velocities.
While the industry treats exit velocity and launch angle as primary metrics, those numbers are effects. Collision geometry is the cause. It is directional intent, constrained by pitch location, that establishes success or failure upstream of exit velocity and launch angle.
That is also why exit velocity can be deceptive. Overvaluing EV encourages hitters to chase peak barrel-speed states even when the pitch location does not support a commensurate geometric solution. The hitter can still generate elite EV, but the collision is now operating in a directionally constrained space where the spray outcome is easier to defend.
This risk is most visible on outer-third pitches. To access a late-arc, peak-speed collision state on an outer-third pitch, the hitter often broadens the swing arc so the collision behaves like an out-front solution. That adjustment can preserve barrel speed, and procudce high exit velocities but it increases the likelihood that spray direction will violate what is commensurate for the pitch location. The result is high-energy contact paired with higher out probability, not because the ball was not hit hard, but because the geometry was already broken at the decision level.
The Blind Spot of xwOBA
xwOBA assigns elite values to outs because it calculates value based on potential (EV + LA) while remaining blind to the horizontal vector (Spray Direction). As a result, the metric assigns elite values to biomechanically inefficient contacts that are directionally suppressible, treating extreme velocity as sufficient to overwhelm defensive alignment. In doing so, xwOBA conflates energy transfer with execution quality and fails to recognize that a hard hit ball (95 mph+) can be predictably neutralized when collision geometry directs that energy into defensive coverage.
The Blind Spot of BABIP
The suppression of offense on these balls creates a large gap between their theoretical value (xwOBA) and realized outcomes. Traditional analysis labels this gap as “unlucky,” assuming that 120 mph contact will regress toward higher hit rates over time. However, conditioning BABIP on CGD shows that this suppression is a stable feature of the collision geometry rather than a statistical anomaly.
The Reconciliation: CGD
CGD reconciles the blind spots in both xwOBA and BABIP by quantifying the geometric opposition between pitch location and swing vector. xwOBA measures contact magnitude (EV and LA), while BABIP judges realized outcomes against historical baselines. CGD supplies the missing causal layer: vector efficiency at collision. When force is high but geometry is misaligned (high CGD), the model predicts suppressible trajectories and elevated out rates, so low BABIP in these cases is not “bad luck” or a short-sample anomaly. It is the expected consequence of persistent geometric deviation. In this framework, “hard-hit outs” are not victims of variance. They are victims of physics.
Study Design and Data Acquisition
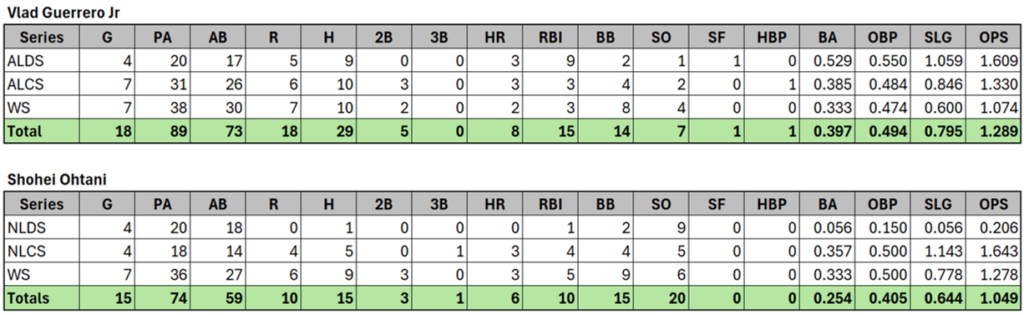
To validate the explanatory power of CGD, this study isolates high-leverage performance data from the 2025 Major League Baseball postseason. The dataset encompasses all plate appearances from the American and National League Division Series, Championship Series, and World Series. The analysis focuses specifically on two distinct hitter profiles: Shohei Ohtani and Vladimir Guerrero Jr.
The primary filter applied to this dataset is the presence of a swing event. No-Swing outcomes such as bases on balls and strikeouts are excluded from the sample (CGD). While these outcomes have value in general production metrics, they provide no geometric evidence regarding the collision point or barrel orientation. Consequently, they do not allow for the reconstruction of directional intent. The final dataset consists exclusively of balls in play and foul outs. However, to normalize sample disparities, an augmented metric CGD+ includes strikeouts.
Equally important is the metric does not differentiate between safe hits or outs. EV and LA are also not included in the geometric inference process. These metrics describe the quality or efficiency of the collision (effect) rather than the spatial decision of the swing (cause). Because LA and EV are heavily influenced by vertical offset and precise timing, they do not necessarily reflect the batter’s directional intent. A batter can execute the correct barrel orientation for a specific pitch location yet mistime the collision, resulting in a weak hit. By strictly filtering these variables out, we ensure that the metric measures the intent rather than the result, preventing “outcome bias” from contaminating the analysis of the decision. Therefore, this study isolates the spatial intent solely through the relationship between pitch location, spray direction and barrel orientation.
A critical constraint of this research is the nature of currently available public tracking data. While Statcast provides precise measurements of the ball’s flight, including velocity, spin, and trajectory, they do not publish collision coordinates or barrel orientation data. Consequently, the public dataset lacks the three input variables required for causal analysis: collision depth (D), barrel orientation (θ) and initial spray direction (φ). We know the result of the collision, but the dataset does not explicitly record where the collision occurred in space or the angle of the implement that created it for each specific event.
To overcome this blind spot, this study reconstructs the missing input variables through geometric inference. For each at-bat, the pitch location and resulting spray direction were used to infer the barrel vector required at impact, applying the reflected half-angle relationship between spray direction and barrel orientation. These inferred barrel angles and collision depths were evaluated against a precomputed Spatial Swing Map that defines universally relative contact depths and commensurate barrel orientations, enabling direct apples-to-apples comparison across hitters. This required manual, event-by-event analysis of video for Ohtani and Guerrero Jr., treating the ball’s horizontal trajectory as forensic evidence of the geometric decision made at contact. These inferred contact parameters were then evaluated against the Spatial Swing Map to compute CGD for each collision event.
Inter-rater reliability and sensitivity analyses are planned once direct collision-level measurements become available, allowing validation of the inference process and assessment of robustness to small angular perturbations.
Methods
We analyzed three postseason series for Vladimir Guerrero Jr. and Shohei Ohtani in which swing events were recorded. Collision events were defined as balls put into play, including outs and sacrifice flies, while hit-by-pitch events were treated as non-swing outcomes and excluded. CGD was computed only for collision events, with strikeouts tracked separately and incorporated only in CGD+ as penalized non-collision outcomes.
For each contact event, pitch location and spray direction were obtained from manual analysis of video. Barrel orientation was inferred using a reflected 2:1 relationship between spray direction and barrel angle.
Expected collision depth and barrel orientation were defined using a precomputed Spatial Swing Map, which specifies the allowable spray-direction and reflected barrel-angle ranges for each of the 25 pitch locations, separated by hitter handedness. For a given pitch location, the map defines the expected collision depth along the swing arc and the corresponding barrel orientation required to produce the commensurate spray direction. These expected values serve as the geometric reference against which observed contact parameters are evaluated when computing CGD.
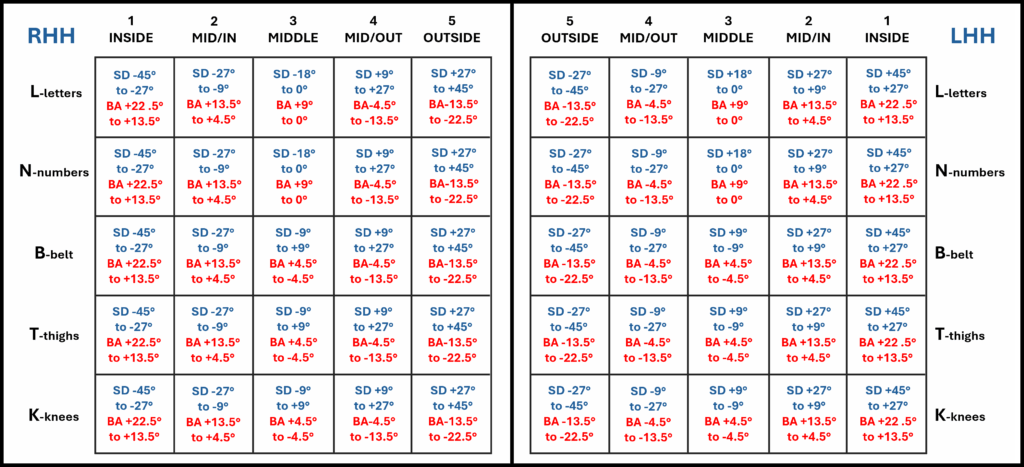
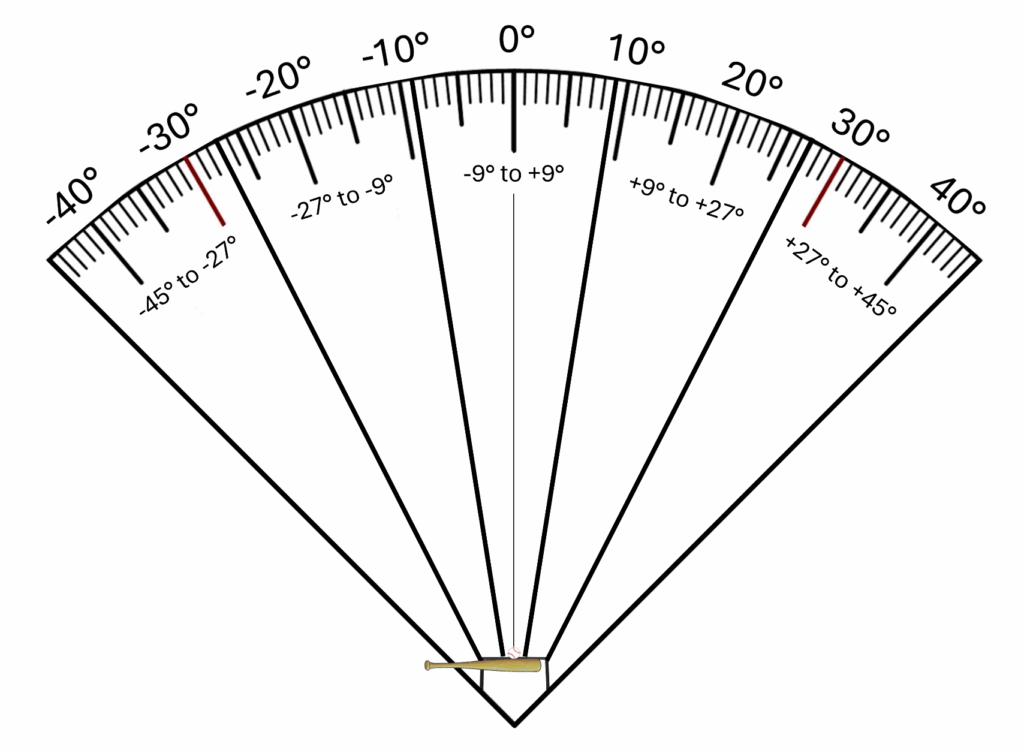
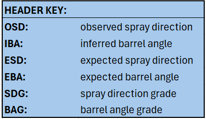
This figure illustrates the spray-direction reference framework used to operationalize the Spatial Swing Map at contact. Centered at home plate, the field is divided into uniform 18° angular intervals spanning −45° to +45°, including a central corridor (−9° to +9°) and symmetrically spaced lateral ranges. These intervals represent the allowable spray-direction bands defined by the map for evaluating contact outcomes.
The framework is anchored to the keystone moment, which establishes the zero reference for barrel orientation and forward swing direction. For any pitch location, the expected spray interval corresponds to a specific collision depth along the swing arc and a reflected barrel-angle requirement necessary to produce that trajectory. Observed contact is evaluated against these keystone-anchored intervals to determine alignment or deviation from the pitch-specific geometric solution when computing CGD.
CGD was computed as a weighted Euclidean distance between observed and expected collision depth and barrel orientation, with weights normalizing spatial and angular terms. Lower CGD indicates closer geometric alignment with the pitch solution; higher CGD indicates greater deviation.
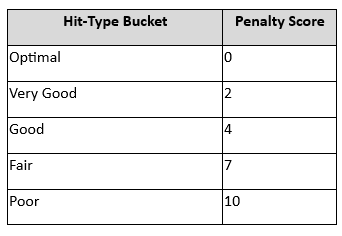
Bucket Construction
CGD values were stratified into five descriptive buckets labeled Optimal, Very Good, Good, Fair, and Poor using fixed CGD threshold ranges. These buckets are used solely to summarize the distribution of collision execution quality and to visualize execution consistency across events. Bucket assignments are derived from CGD outputs and are not used as inputs to CGD or CGD+ calculations. Complete data sets for these events are included in the study’s Appendix B.
Comparison Framework
Three complementary comparisons are performed. Collision-only CGD is used to evaluate geometric execution quality on balls put into play. CGD+ extends this evaluation by incorporating strikeouts as penalized non-collision events to capture total execution cost. Bucket weights are used to compare the distributional shape of execution outcomes, describing how often each hitter operates within optimal through poor geometric ranges without collapsing those distributions into a single score.
Results
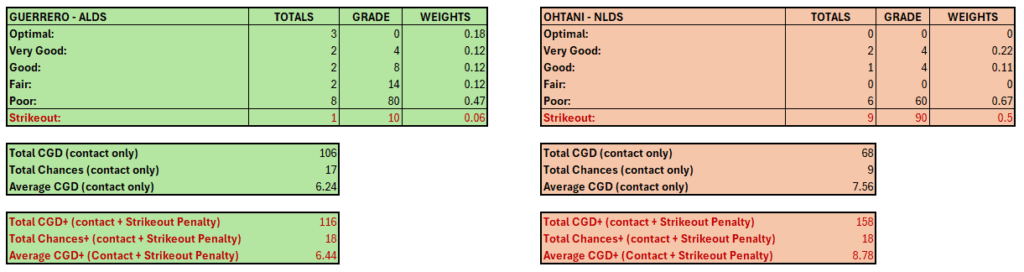
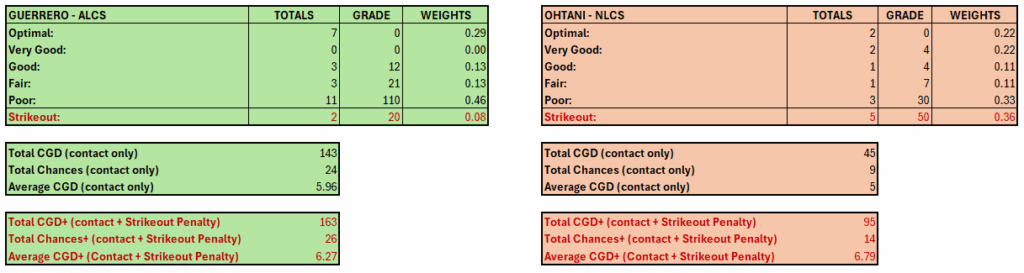
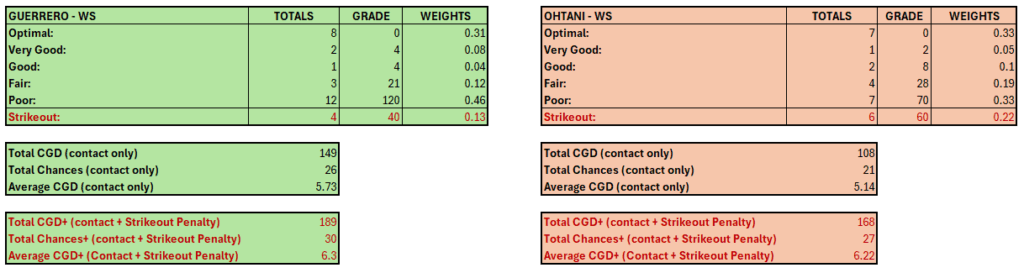
Collision-only CGD and CGD+ were computed for Vladimir Guerrero Jr. and Shohei Ohtani and are reported side by side. Guerrero Jr. recorded an average CGD of 5.94 across 67 collision events, while Ohtani recorded an average CGD of 5.67 across 39 collision events.
When strikeouts were incorporated as penalized events, Guerrero Jr.’s CGD+ was 6.32 and Ohtani’s CGD+ was 7.14.
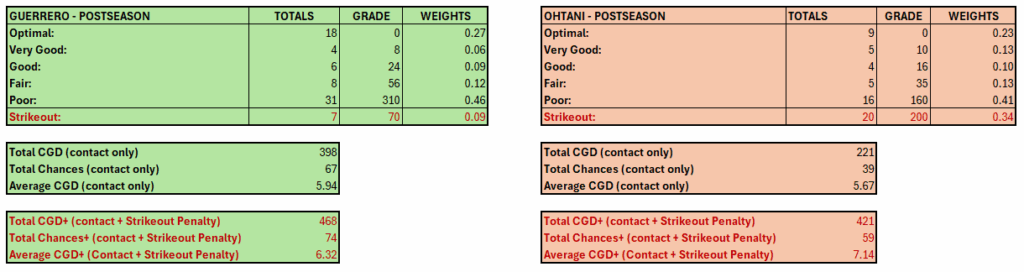
Bucket weight distributions show the proportion of collision events falling within Optimal, Very Good, Good, Fair, and Poor ranges for each hitter, along with strikeout weights reported separately. These distributions summarize execution profiles without aggregating them into a single measure. Further breakdowns by series can be found in Appendix B.
Interpretation
The results separate collision execution quality from contact reliability. Collision-only CGD reflects how closely each hitter’s contact geometry aligned with the optimal solution when contact occurred, independent of outcomes. CGD+ incorporates strikeouts to account for missed collision opportunities, capturing the reliability with which each hitter converts plate appearances into executable collision events. Bucket weight distributions further contextualize these metrics by showing how each hitter’s execution is distributed across geometric quality ranges, without implying success or failure of the resulting batted balls.
Conclusions
This study shows that collision execution quality and execution reliability must be evaluated separately to understand offensive risk. Collision-only CGD indicates that Shohei Ohtani and Vladimir Guerrero Jr. solved the geometric collision problem at comparable levels when contact occurred. However, CGD+ reveals a critical divergence in reliability: Ohtani’s substantially higher strikeout rate materially reduced the frequency with which those optimal collision states were reached.
This framework introduces a causal test for repeatability that outcome-based analysis does not provide. CGD establishes a baseline for collision quality, and CGD+ extends it by accounting for missed collision attempts. In this framework, high-CGD success exposes compensatory contact that can produce episodic positive outcomes but lacks predictable repeatability because the underlying collision geometry remains inefficient. Conversely, low-CGD success reflects correct collision geometry and is therefore most likely to persist over time.
Applied to the 2025 postseason, Ohtani’s home run rate per at-bat confirms that he was dangerous when he solved the collision problem, but CGD+ shows that this occurred less frequently than outcome reputation alone would imply. His substantially higher strikeout rate, combined with elevated walk totals driven by systematic avoidance, materially reduced his total swing and collision opportunities. As a result, pitching strategies that treated all Ohtani plate appearances as equally dangerous overstated his per-appearance collision risk. Guerrero Jr.’s elevated BABIP and batting average, by contrast, exceeded what would be expected from collision geometry alone, indicating outcome amplification beyond execution quality.
The key insight is that CGD and CGD+ shift decision-making from outcome fear to collision likelihood. Ohtani was not uniformly dangerous on a per–plate appearance basis; he was conditionally dangerous when pitch location and count elevated collision probability. Blanket strategies such as pitching around or intentional walks were therefore often responses to outcome reputation rather than evaluations of collision likelihood.
By separating collision quality, reliability, and residual outcome variance, CGD and CGD+ provide a causal framework that explains when traditional statistics align with execution and when they do not. This resolves luck not by regression to historical averages, but by identifying where deviation arises in the causal chain. That distinction is precisely where this framework adds explanatory and decision-making value beyond existing analytics.
Explaining Compensatory Power Outliers (High CGD Success)
Findings
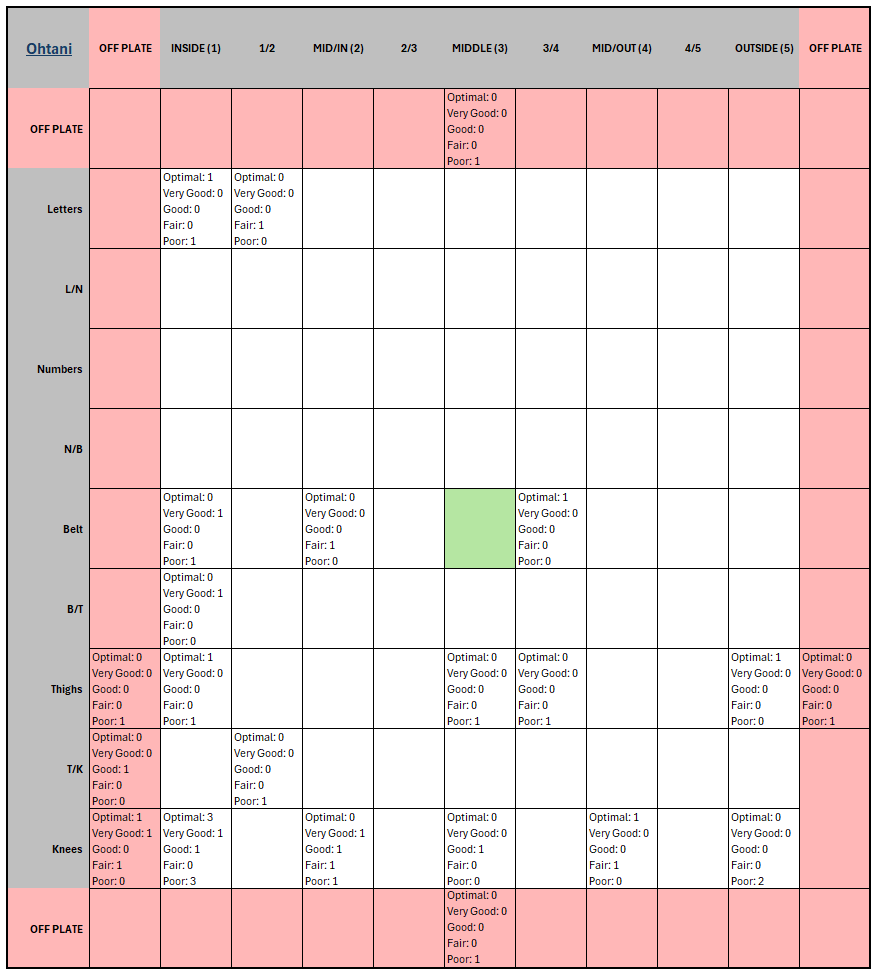
Ohtani: The buckets show that Ohtani’s collision execution is zone-specific, not generalized. His best execution occurs low–inside and inner-middle (K1, T1, B3), while his worst execution occurs low–away (K5), with this weakness extending into adjacent borderline zones. The bucketing reveals a clear spatial gradient rather than isolated failures.
What this tells us: Ohtani solves the collision problem reliably only in a limited set of locations. However, his elevated strikeout rate materially constrains inference about his broader geometric weaknesses, as many potential failure states terminate before collision occurs. As a result, bucketed collision data likely understates the full extent of his spatial vulnerability.
How he should be approached: Avoid low-inside and inner-middle zones where collision efficiency is highest. Emphasize low-away and adjacent boundaries to elevate execution cost. Further resolution of these patterns would benefit from a complementary causal metric, such as Collision Quality Score (CQS), which incorporates pitch velocity and may yield additional insight even in small samples.
Ohtani Collision Buckets Map:
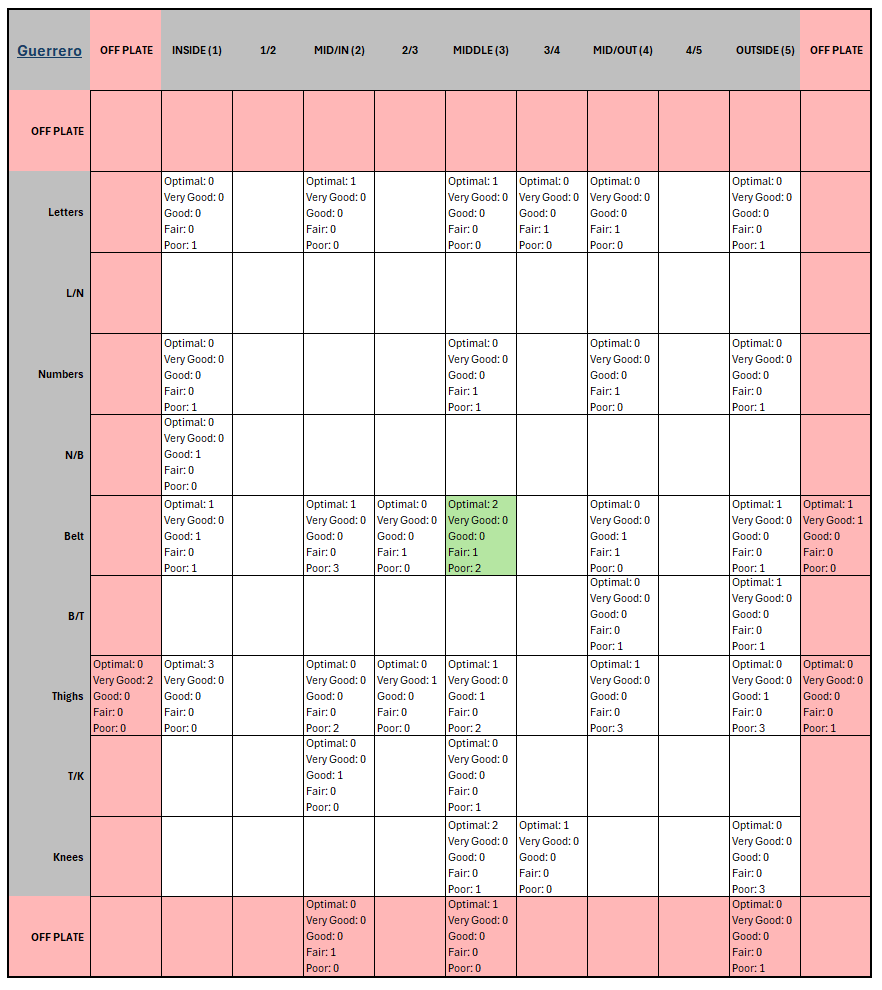
Guerrero: The buckets show that Guerrero’s collision execution is strongest on the inner third at mid-to-lower heights and remains dangerous on elevated outer-belt pitches. Optimal and Very Good outcomes concentrate at T1, B1–B3, and K3, with an additional pocket of success at B5 (2 Optimal, 1 Very Good). Poor outcomes dominate low-away (K5, T5) and extend into adjacent outer-lane zones, where Optimal buckets disappear.
What this tells us: Guerrero reliably solves the collision problem when pitches allow earlier contact or moderate barrel adjustment, including some elevated outer-belt pitches. Execution cost rises sharply when pitches force late, low-away geometry.
How he should be approached: Avoid inner-third lanes and do not challenge at the outer belt. Attack low-away and adjacent boundaries, where Poor buckets dominate and collision efficiency collapses.
Guerrero Collision Buckets Map:
Study Limitations and Assumptions
Methodological Constraints
The analysis treats barrel orientation (θ) as an angular variable expressed in degrees and infers this orientation from the observed horizontal spray direction using a reflected half-angle relationship. This geometric mapping serves as the deterministic baseline for the Spatial Swing Map and for the calculation of CGD.
Barrel Orientation Inference
The inability to directly measure barrel orientation at impact is not a technological limitation but a data-exposure limitation. Current high-frequency optical tracking systems are capable of capturing the spatial position and orientation of the barrel at contact. However, these variables are not generated or standardized in publicly available datasets, nor are they reported within a hitter-centric coordinate system.
As a result, barrel orientation must be reconstructed from the relationship between pitch location and spray direction rather than obtained through direct sensor measurement. This reliance on inference is a consequence of current reporting priorities, not a deficiency in available measurement technology.
Spray Direction as a Non-Instantaneous Proxy
Spray direction presents a separate and independent limitation. Unlike LA, which is reported as an instantaneous post-separation variable, spray direction is typically inferred from the ball’s observed trajectory over distance. As such, it can be influenced by external factors including wind, spin-induced curvature, and atmospheric effects before the ball’s direction is finalized.
These influences do not undermine the study’s objective, but they do bound its precision. Importantly, the same tracking systems that report EV and LA are capable of capturing the initial horizontal launch vector at separation, isolating spray direction at the moment of collision rather than at a downstream point in flight. That capability exists but is not exposed.
Paradigm Constraint
The coexistence of these limitations reflects a broader paradigm constraint in modern hitting analytics. Current systems prioritize descriptive, outcome-based reporting such as EV, LA, and landing-based spray direction. While sufficient for result characterization, this paradigm deprioritizes direct measurement of the collision event itself and its governing geometry.
This study operates within those constraints while simultaneously highlighting them. The need to infer both barrel orientation and spray direction is not intrinsic to the problem being studied, but rather to the industry’s focus on outcomes over causality. The findings therefore serve not only as analysis, but as an argument for a shift toward automated reporting of collision-state variables, specifically contact depth (D) and barrel orientation (θ), with the same rigor currently applied to ball-flight metrics.
Accordingly, this study argues for automated reporting of collision-state variables, specifically barrel orientation (θ) and contact depth (D), rather than continued reliance on ball-flight outcomes alone. These variables serve distinct roles: barrel orientation constrains directional intent, while contact depth specifies where along the swing arc the collision occurred.
Contact depth is therefore not a secondary refinement but a co-equal determinant of collision geometry. Without depth, barrel orientation remains temporally ambiguous and collision analysis collapses back into descriptive correlation.
The core limitation is not capture capability but coordinate definition. Without a hitter-centric coordinate system anchored to an invariant anatomical reference, collision-state variables cannot be standardized across hitters. Statcast’s current public coordinate paradigm is optimized for ball-flight description rather than collision-state reporting, which forces causal geometry to be reconstructed rather than directly retrieved.
For scope, the coordinate problem and its implications for depth capture and swing-arc ambiguity are treated conceptually in this study. A full formalization is provided in Appendix A.
Future Applications and Downstream Metrics
CGD is intentionally defined as a baseline metric. It evaluates whether a hitter solved the geometric collision problem dictated by the pitch, independent of outcome magnitude. By isolating execution geometry, CGD introduces causal structure where current hitting metrics rely primarily on historical aggregation.
Metrics like barrels, and hard-hit rate grade contact force while remaining blind to directional correctness. High-EV events produced with high CGD represent compensatory misdirection that may succeed episodically but will fail predictably against defensive alignment and sequencing. CGD therefore separates reliable damage from successful outliers, preventing rare high-value outcomes from being misclassified as repeatable strengths through the availability heuristic.
Spray direction profiles are likewise disambiguated. A pull-heavy distribution may reflect geometric dominance or repeated rollovers. CGD distinguishes intentional solutions from compensatory outcomes that are inherently suppressible, restoring interpretive value to spray data.
Downstream metrics can therefore be constructed in the correct causal order. Collision Quality Score (CQS) is one such extension, explicitly built on top of CGD. While CGD remains universal and hitter-agnostic, CQS re-incorporates EV, LA, hitter-specific physical ceilings, postural efficiency, and resultant impact to translate geometric execution into expected offensive value. CGD answers whether the swing geometry was correct; CQS quantifies how valuable that correctness is for a given hitter. A full formulation of CQS and its integration with CGD is developed in Appendix A.
CGD and CGD+ also enable evaluation of bat speed gains in their proper causal context. Increases in bat speed are typically treated as unqualified improvements, yet gains are often achieved through broadened swing arcs and increasingly pull-centric swing decisions that carry geometric cost. By conditioning outcomes on CGD, apparent performance gains can be separated into true efficiency improvements versus compensatory force increases that elevate deviation. CGD+ further reveals whether speed gains improve collision opportunity or merely amplify execution risk. This allows training, development, and swing changes to be evaluated not by raw speed alone, but by whether added force preserves or degrades repeatable collision geometry.
Crucially, these same causal distinctions translate beyond hitter development to opponent strategy. Once collision quality and reliability are disentangled, execution geometry becomes observable not only as a training variable but as an exploitable constraint. The same geometric costs that accompany certain swing adaptations define where collision likelihood collapses, creating actionable structure for run prevention.
From a pitching perspective, this separation is decisive. CGD provides a zone-by-zone execution fingerprint identifying where a hitter reliably solves or fails the collision problem, independent of outcomes. CGD+ extends this framework by incorporating strikeouts as missed collision opportunities, enabling evaluation of both execution quality and execution reliability. Together, these metrics shift strategy from outcome fear to collision likelihood, supporting matchup planning and sequencing grounded in causal geometry rather than reputation.
Appendix A
This appendix provides conceptual and structural context necessary to interpret the methodological constraints of the study. It is not intended as a comprehensive review of public tracking systems, nor as a full specification of the proposed coordinate framework, but rather as an explanation of why existing measurement paradigms necessitate inference in the present analysis.
A.1 The Asymmetry Between Pitching and Hitting Analysis
Modern baseball analytics exhibit a fundamental asymmetry between pitching and hitting that is often mistaken for a difference in data quality or model sophistication. In reality, the asymmetry is rooted in reference-frame logic.
Pitching analytics evolved into a closed-loop, causally interpretable system by anchoring all measurements to an anatomical origin: the release point. This point represents the true mechanical Event Zero, where the pitch’s trajectory begins. By defining a stable anatomical origin and tracing ball flight forward from that point, analysts can reverse engineer movement, velocity, and trajectory back to specific biomechanical inputs. The pitching task is therefore fully parameterized within a consistent coordinate system.
Hitting analytics never completed this transition. Instead of identifying an anatomical Event Zero for the collision, the industry retained an environmental landmark, home plate, as the primary reference. This decision created a structural imbalance. While pitchers are analyzed relative to their own bodies, hitters are analyzed relative to the field.
The result is not a lack of precision, but a lack of causality.
A.2 The Dimensional Mismatch of the Strike Zone
The strike zone appears symmetric to pitchers and hitters, but it is not functionally equivalent. For the pitcher, the strike zone is a two-dimensional target defined by where the ball crosses the plate. Depth is irrelevant once the pitch leaves the hand.
For the hitter, the strike zone is a three-dimensional volume. Depth is a decisive geometric axis that extends through the plate and into the contact space in front of it. The hitter’s task is not to meet the ball at the plate, but to intersect a moving pitch trajectory with a rotating swing arc at a specific point in space and time.
This spatial–temporal intersection defines the fundamental geometric solution of hitting. Any analytic framework that collapses the strike zone into two dimensions necessarily discards this axis and replaces geometry with outcome averaging.
A.3 The Current Measurement Standard: Intercept Point
Statcast’s current system for reporting contact depth is known as Intercept Point. Using high-speed optical tracking, the system identifies the three-dimensional coordinates where the bat and ball intersect.
To facilitate comparison across hitters, depth is reported in two ways:
- Relative to the front edge of home plate.
- Relative to the hitter’s center of mass at setup.
This dual reporting is intended to correct for differences in where hitters stand in the box. On the surface, it appears to solve the plate-centric problem. In practice, it introduces a deeper one.
A.4 The Invariance Failure of Plate and Center-of-Mass Anchors
Plate-relative depth fails because it measures a biological event against a geological landmark. Since hitters are mobile and the plate is fixed, plate-relative measurements primarily describe setup geometry rather than swing execution.
The introduction of the center of mass as a corrective anchor attempts to shift the origin from the field to the athlete. This correction fails for three reasons.
First, the center of mass is not an invariant anatomical constant. Its position varies with stance width, posture, and knee flexion before the swing begins. Two hitters with identical swing mechanics but different setups will register different depth values.
Second, morphological non-universality ensures that the center of mass does not occupy the same anatomical location across bodies. Leg angles (GFA) and mass distribution shift its position relative to the feet and swing arc.
Third, dynamic drift creates a hard logical barrier. During the launch of the swing, the center of mass may be translating forward. When the coordinate origin moves at the same moment the collision occurs, depth becomes undefined. No amount of statistical smoothing can correct a reference frame whose origin is not fixed.
Averaging across swings does not solve this problem. It masks setup contamination and dynamic drift by smoothing over structural error, creating the illusion of precision while obscuring the actual mechanics of the collision.
A.5 Outcome-First Analytics as a Consequence of Coordinate Failure
Because collision-state variables cannot be expressed in a stable reference frame, modern hitting analytics default to outcome-first descriptors. Exit velocity, launch angle, spray direction, barrels, and expected-value models quantify the consequences of the collision rather than the collision itself.
This forces analysts to infer execution quality from historical averages and distributions. Variance is attributed to luck or regression when it is often the deterministic result of geometric misalignment. Successful outliers are misclassified as repeatable skill, while mechanically sound swings with poor outcomes are dismissed as noise.
The absence of a valid coordinate system is what turns hitting analysis into a descriptive exercise rather than a causal one.
A.6 The Coordinate Solution: An Invariant Hitter-Centric Reference Frame
To create a universal coordinate system for hitting, the origin must be an invariant anatomical anchor that remains constant regardless of setup, posture, or style.
A.7 The Keystone Swing Moment and Orientation Locking
A complete reference frame also requires a standardized orientation. The Keystone Swing Moment provides this constraint. Defined as a neutral barrel orientation on a belt-high, middle pitch driven to center field, it reveals the hitter’s natural swing radius and arc orientation.
By anchoring orientation at this moment, the coordinate axes are aligned to the hitter’s own geometry rather than to an external field reference. From this keystone, all other collision points along the swing arc can be extrapolated deterministically.
In addition to its role as a standardizing reference, the capture and evaluation of barrel orientation at contact, including horizontal and vertical angular deviation independent of contact depth, is itself subject to pending intellectual property protection with the same priority date and is treated here at a conceptual level only.
A.8 Inter-Hitter Comparability and Stability Over Time
The primary analytical consequence of an invariant hitter-centric coordinate system is comparability. When collision geometry is measured relative to a stable anatomical origin and a standardized orientation, contact depth and barrel alignment become commensurable across hitters and across time. This allows identical geometric events to be identified as such, regardless of stance, posture, or body type.
Under plate-relative or center-of-mass–relative systems, apparent differences in contact depth or timing may simply reflect setup variation rather than execution. As a result, isolated successes cannot be reliably distinguished from stable geometric skill. A hitter who produces damage from compensatory geometry may appear identical, in aggregate outcomes, to a hitter who consistently solves the collision problem correctly.
By contrast, a hitter-centric coordinate system enables collision events to be evaluated against a fixed geometric baseline. Outliers can then be classified as either stable deviations that persist across repeated contacts or transient successes that do not recur under identical geometric constraints. Over time, this resolves the ambiguity between success and repeatability, allowing geometric signal to be separated from noise without reliance on outcome averaging.
This distinction is not recoverable from historical result distributions alone. It requires a coordinate system capable of expressing collision geometry as a repeatable state rather than an inferred effect.
A.9 Mechanistic Consequences
Once this coordinate framework is adopted, contact depth becomes a measurable variable rather than an interpretive one. Analysts can state, mathematically, that one hitter contacts the ball deeper or farther out front than another, independent of stance or morphology.
This resolves the black-box nature of the collision. Expected-value models can then operate downstream of geometry rather than in its absence. Hitters can be evaluated on repeatable execution rather than on borrowed outcomes. Pitchers can attack geometry rather than reputation.
A.10 Collision Quality Score (CQS) and Geometry-Conditioned Valuation
Collision Geometry Deviation (CGD) is intentionally defined as a magnitude-free baseline. It evaluates whether the hitter reached the correct location on the swing arc with the correct barrel orientation for a given pitch, independent of exit velocity, launch angle, or outcome value.
Collision Quality Score (CQS) is a downstream metric that operates conditionally on CGD. Once geometric execution has been established, CQS reintroduces outcome magnitudes to evaluate the practical value of a swing relative to the hitter’s individual physical profile. In this framework, exit velocity, launch characteristics, and directional match are treated as effects of geometry, not inputs to it.
This separation preserves causal order. CGD isolates execution quality and establishes a universal geometric baseline across hitters and zones. CQS then translates that correct (or incorrect) geometry into hitter-specific offensive value by incorporating power ceilings, postural efficiency, and resultant impact. Magnitudes are therefore not ignored, but intentionally deferred until geometry has been resolved.
A full specification of CQS, including its weighting structure and integration with count and leverage context, is beyond the scope of this study. Its inclusion here is intended to clarify system architecture and to distinguish geometry-first evaluation from outcome-first grading.
Appendix B: Raw Event Data and Aggregation Tables
B.1 Aggregation Tables By Series
Division:
Championship:
World Series:
B.2 Raw Event Data
Vlad Guerrero Jr Raw Event Data:
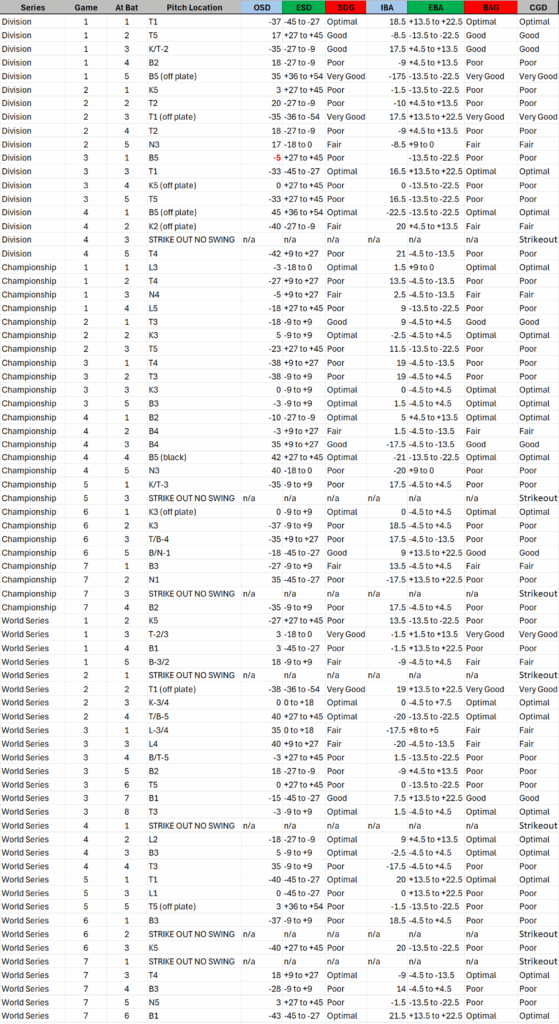
Shohei Ohtani Raw Event Data: