Fernando Tatis Jr.’s Power Outage: Why Driveline’s Timing Diagnosis Misses the Real Failure
How Driveline and Causal Analytics Diagnosed the Same Paradox, and Why the Answers Diverged
By Ken Cherryhomes ©2026
40-GAME PROFILE - FERNANDO TATIS JR. 2026
| 58.6% Hard-Hit | 92.0 mph Avg EV | .327 BABIP | .293 xwOBA | 0 HR | 3 XBH |
| Avg CGD: 6.49 | Avg CGD-HH: 4.16 | Avg CQS: 9.23/30
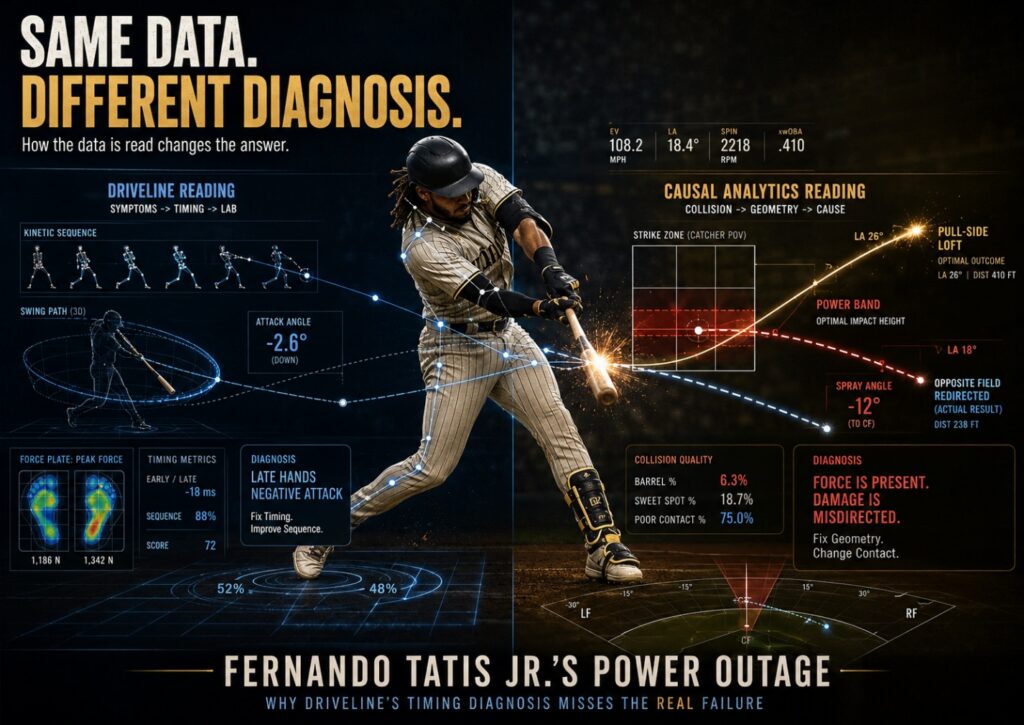
Fernando Tatis Jr.’s 2026 power outage produced two evaluations of the same public contradiction. Both started with the same Statcast data. Both identified the same surface paradox. They arrived at fundamentally different diagnoses, because they were asking fundamentally different questions.
The Same Contradiction, Two Different Questions
Driveline Baseball published a forensic investigation of Fernando Tatis Jr.’s power outage in May 2026. The problem was plain. Tatis was still producing elite contact indicators – hard-hit rate, average exit velocity, bat speed, barrel rate, sweet-spot rate. The force was still there. The damage was not.
Driveline identified the visible symptoms accurately. Deeper contact. Lower attack angle. More opposite-field direction. A more closed stance. Collapsed pull-side air contact. Even Tatis acknowledged the confusion: “I don’t know what the (expletive) is going on,” he told reporters. “But, man, just keep going out there and keep grinding.” Dylan Robertson, a Driveline hitting trainer, summarized the issue directly: “He’s just late.” Tanner Stokey, Driveline’s director of hitting, then explained what Driveline would need to move from symptom description to prescription: “In terms of the prescription for cleaning it up, that’s why I’d like to get hitters in the mocap lab. See exactly how he’s moving.” Stokey continued: “This comes back to wanting to have as much information as possible on ‘Why?’”
That sequence matters. Tatis describes confusion. Driveline identifies the visible swing symptoms, reduces the diagnosis to timing, then says the next step is motion capture to find the “Why?” That is their framework. It reflects the tools and questions biomechanical development pipelines are built around. But in this particular case, it also exposes the limitation of that framework. Driveline identifies the symptoms, then moves the answer out of the public data and into the lab. The implication is that the numbers can show what is happening, but not why it is happening.
The issue is not that the data is silent. The issue is that the wrong framework stops listening too early.
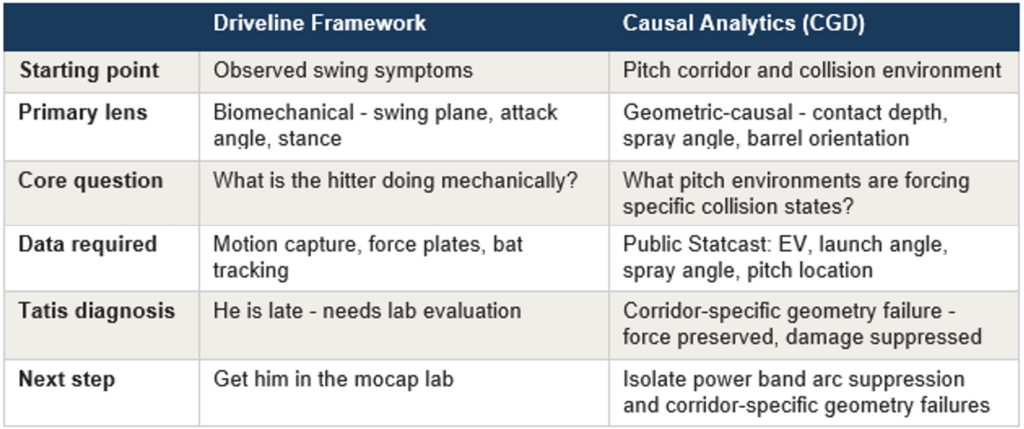
Driveline asks: what is the hitter doing mechanically? Causal Analytics asks: what pitch environments are forcing the swing into different collision states, and what is the hitter’s intent producing inside the power band? Those are not the same question.
Why "He's Just Late" Is Not Enough
The timing diagnosis explains part of the visible pattern. Late contact produces deeper contact points. Late contact produces opposite-field direction. Late contact reduces pull-side air balls. These connections are real.
But the timing explanation creates a metrics contradiction it cannot resolve. A hitter who is simply late should show broader degradation across impact quality – more defensive contact, weaker exit velocity against premium pitching, less consistent ability to square the baseball. That is not Tatis’s profile.
The Contradiction: He is still hitting the ball hard. His exit velocity remains elite against 97-mph four-seamers and sinkers. The barrel is still arriving with enough energy to punish the baseball. The primary failure is not arrival. It is conversion.
A timing problem should disturb force production. A collision-geometry problem can preserve force while destroying damage. Those are different diagnoses, and only one of them explains what the numbers actually show.
The timing label is incomplete. It describes the direction of the miss without explaining why elite force persists while home-run production has disappeared. To find that explanation, the analysis has to move upstream – to the pitch environment, the intent zone, and what is happening to arc geometry inside the power band itself.
The Power Band and the Intent Problem
The power band refers to the region of the strike zone where a hitter has the greatest opportunity to convert force into pull-side airborne damage: roughly middle-inside through middle-outside, from the thighs to the numbers. These locations give the hitter enough space to broaden the swing arc, extend forward through collision, and organize barrel direction toward loft rather than ground-ball or opposite-field conservation.
That definition matters because the power band is not just a location. It is a collision opportunity. When a hitter attacks these pitches with power intent, the swing must use the geometry the zone affords. On inner-third pitches, that means the barrel has to clear forward with enough arc circumference to create pull-side loft. On middle and middle-outside pitches, that means the arc must broaden forward through the collision window so elite force can travel upward and to the pull side rather than straight through, downward, or away.
Tatis still recognizes these pitches. Inside the power band, he is producing a 77% hard-hit rate. The problem is not pitch recognition or force. The problem is what his swing is doing with the opportunity. He is generating power-level force in the region most capable of producing power damage, but the arc geometry needed to fulfill that intent is not being applied correctly.
In the power band, the exact pitches that should be producing home runs, 72.2% of Tatis’s hard-hit balls are being directed toward center field, right-center, or the opposite field. The intent is present. The arc broadening that would convert that intent into pull-side damage is not.
Through 40 games, his average launch angle inside the power band has collapsed to -10 degrees. That is not a hitter who is late. That is a hitter whose arc is suppressed at the exact moment it needs to broaden. The force is arriving. The geometric conversion window, the brief moment where the barrel, moving through a broadened arc with forward extension, can redirect that force upward and to the pull side, is being closed off before it opens.
Zero Pulled Extra-Base Hits From the Power Band
The extra-base-hit distribution makes the problem undeniable. Through 40 games, Tatis produced only 6 extra-base hits despite maintaining elite hard-hit and exit-velocity profiles across the season.
From the Power Band: 31 hard-hit balls, 0 home runs, and 0 pulled extra-base hits. Twenty-one of those 31 hard-hit balls were sent to center field, right-center, or right field. Eleven were hit at 108 mph or harder, yet only two became extra-base hits, both to center or the opposite field. The issue is not missing power. It is misdirected power.
Those two batted balls represent exactly the problem. Exit velocities that would produce home runs under normal pull-side arc geometry are instead being driven straight or away. The force is catastrophically present. The broadened arc that would redirect it upward and toward the pull side is absent.
Approach: Aggression Outside the Power Band
The intent problem compounds at the approach level. In hitter leverage counts, counts with one or fewer strikes, where elite power hitters concentrate aggression inside the power band to maximize pull-side lift, Tatis is repeatedly attacking locations with the lowest damage conversion in the strike zone.
Outside / knees (leverage counts): 21 opportunities, 18 swings, 3 takes, 85.7% swing rate, 10 outs, 0 XBH, 5 hard-hit balls.
Middle / knees (leverage counts): 11 swings, 7 outs, 1 XBH
Inside / knees (leverage counts): 7 swings, 6 outs, 0 hits, 0 XBH
Across all counts, outside pitches from the knees to the thighs produced 10 strikeouts. Middle-outside pitches at the knees produced 8 more. These are regions where the swing arc cannot broaden into pull-side loft regardless of how well the hitter executes, the pitch geometry simply does not afford it.
The paradox sharpens when comparing intent profiles. Tatis’s conservative center-field and opposite-field swings currently produce better launch angles and higher slugging than his deliberate pull-side power attempts. That inversion is not physical. It is geometric. The arc he applies to power attempts is not producing the geometry those attempts require.
What CGD-HH Reveals: The Metrics Behind the Paradox
Conventional metrics cannot isolate this failure because they do not separate interception from damage conversion. A hitter can successfully meet the baseball in space – interception – while simultaneously failing to produce the barrel orientation, broadened arc, and directional expansion required for airborne pull-side damage. Those are different geometric events, and they require different evaluative tools.
Causal Analytics addresses this through two proprietary metrics built on top of the same public Statcast data everyone uses.
CGD (Collision Geometry Deviation) measures whether spray direction remained geometrically commensurate with pitch location. A score of 0 is optimal. Increasing scores represent increasing deviation from expected geometry relative to where the pitch was located.
CGD-HH isolates only hard-hit collisions and evaluates whether high-force contact occupied the broader spray and launch affordances associated with intentional damage conversion inside the power band. This metric applies broader tolerances than CGD because hard-hit contact inside the Intent Zone is not expected to behave like survival contact. When a hitter recognizes a pitch in the power band, the evaluation standard shifts: the expectation is that the hitter applies a second-order damage objective, broadening the swing arc and expanding collision geometry toward pull-side damage space. CGD-HH measures whether that actually happened.
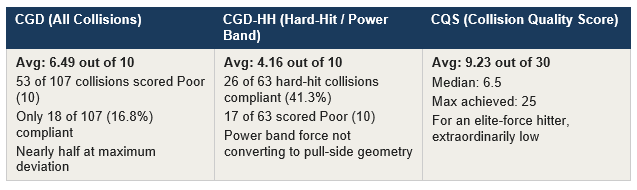
The CGD-HH finding is where the power band failure becomes numerically explicit. Of 63 hard-hit collisions, only 26 (41.3%) were compliant with the broadened pull-side damage geometry expected inside the power band. Seventeen scored the maximum deviation of 10. The highest-force collisions, exactly the ones that should be producing home runs, are repeatedly failing to expand into pull-side launch space.
The barrel-angle data confirms the same pattern: Tatis’s average horizontal barrel angle through 40 games is -1.83 degrees. For an elite power hitter, a negative horizontal barrel angle means the barrel is arriving through contact in a downward or neutralized launch orientation rather than occupying the broadened forward-launch geometry associated with airborne pull-side damage. The barrel is not sweeping through the arc. It is arriving at the ball from above it.
The combined CQS (Collision Quality Score), which integrates CGD, CGD-HH, force production, and descriptive outcomes, averages 9.23 out of a possible 30. For a hitter maintaining elite exit velocity and elite hard-hit rates, that number is the statistical signature of the force/damage paradox: maximum engine output, minimum damage conversion.
The High-Resolution Trap
When traditional analytics encounters something it cannot explain, it reaches for more data at higher resolution. If a hitter’s breakdown is caused by a spatial mismatch in a specific pitch corridor, capturing that mismatch at 480 frames per second in a laboratory still only yields a more detailed picture of the symptom. The camera is faster. The diagnosis stays at the wrong level.
The motor system does not randomly choose to flatten a swing plane or shorten an arc. It reorganizes in response to a spatial constraint. The pitch is the task. The collision is the event. The swing is the response. If the pitch environment is not isolated, if the question is not asked at the power band level, corridor by corridor, arc behavior by arc behavior, the response gets mistaken for the cause.
The high-resolution trap: Assuming that a sharper description of a symptom will eventually reveal a cause. A lab can measure the resulting downstream changes with extreme precision, but it cannot explain why the motor system chose that specific mechanical solution, because the lab captures the adaptation, not the constraint that forced it.
Two Failure Modes, One Structural Problem
Inside the power band, the arc suppression manifests differently by corridor, and that is the detail a single timing diagnosis cannot address.
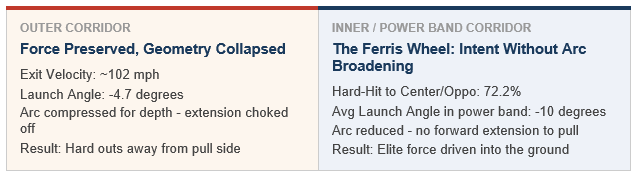
Inner Third: Arc Compression and the Ferris Wheel
On inner-third pitches, the prime pull-side damage corridor, the collision data points to a conserved swing arc adopted to achieve deeper barrel contact. The arc enters the zone earlier but completes its useful path sooner. Extension is choked off before the barrel can clear the front hip and propagate forward into pull-side damage space.
What makes this counterintuitive is that the timing gain is minimal. Against a 97-mph pitch averaging 93 mph over 54 feet, contacting the ball 8 inches deeper provides roughly 5 milliseconds of additional reaction time. For a hitter who already produces elite bat speed and has a proven history of handling premium velocity, that 5-millisecond margin is not the meaningful variable. The conserved arc is unnecessary for successful interception – and its geometric cost is severe.
The Ferris Wheel effect emerges from the same conserved arc. As swing space narrows with deeper contact, vertical bat angle (VBA) compensates. The barrel moves more upward and outward through impact rather than sweeping through a horizontal arc. The result is a plane-of-impact mismatch: the ball is struck hard from the lower-inside quadrant of the barrel face, producing an inside-out slice orientation that redirects force toward center and the opposite field despite elite exit velocity.
Force is present. The direction of that force is structurally wrong.
Middle to Middle-Outside: Arc Broadening That Never Happens
Middle and middle-outside pitches in the power band represent a different failure. These are locations where a right-handed power hitter can still create pull-side or left-center loft if the barrel expands forward through the collision window.
Tatis is hitting these pitches extremely hard. The 108.3-mph opposite-field double and the 113.5-mph center-field double both originated from this corridor. The exit velocities are home-run caliber. The arc, specifically the forward broadening and upward propagation of force that would send those balls over the wall, is absent. The ball is being struck through rather than up and through.
The structural summary: On inner-third power band pitches, the arc is compressed and the VBA compensates vertically, redirecting force away from the pull side. On middle-to-outside power band pitches, the arc fails to broaden forward, suppressing the upward launch geometry that converts elite exit velocity into flight. Two different mechanical failures, both inside the power band, both producing the same result: home-run force without home-run damage.
The Control Condition
Mid-velocity fastballs (90-94 mph) on the inner third at thigh height produce a .444 average with a positive launch angle. This corridor, where the swing geometry still aligns, confirms the physical capability is intact. It also isolates exactly where the arc problem begins and ends. This is not a player in decline. It is a player whose arc behavior is failing specifically inside the power band damage corridors while remaining functional in others.
What the Padres Actually Have to Solve
The dual-axis failure inside the power band creates a strategic problem that a single timing correction cannot address. Correcting inner-third arc compression requires restoring extension, allowing the barrel to continue its arc through the front hip and into forward launch space. Correcting the middle-to-outside forward arc broadening requires a different adjustment, one that prioritizes upward and forward propagation rather than simply earlier contact.
These are not identical adjustments. In some cases they compete. A fix applied to one corridor can worsen the other. That is why the diagnosis has to precede the prescription – and why the diagnosis has to be corridor-specific.
The competitive reality: Opposing pitching staffs do not need to understand CGD-HH to exploit this pattern. They only need to observe what works – continue feeding the low outer-half early, then challenge inner velocity where the vertical compensation becomes self-defeating. The scouting report will find the weakness empirically. The question is whether the Padres’ player-development response identifies the cause at the right level before the league finishes the job.
The Falsifiability Test
LIVE PREDICTION
Tatis will continue to underperform his raw contact metrics unless arc behavior inside the power band changes. If the inner-third compression and the middle-corridor forward broadening failure remain, power suppression will continue despite elite force metrics. If those geometric patterns change and power returns, the framework is supported. If those patterns change and power does not return, the specific force-conversion claim is weakened. Either outcome is informative – and only a causal claim produces a testable prediction at this level of specificity.
A descriptive claim says Tatis looks late. A causal claim identifies where the arc is failing, why the power band is not converting force, and what specific geometric changes must occur for home runs to return. Only one of those claims is testable, and only one of them was arrived at from the public numbers alone, without a lab, without proprietary hardware, and without access to anything unavailable to every analyst in the sport.
The data was always available. The framework is what was missing.
References
Shawchik, T. (2026, May). How in the heck has Fernando Tatis Jr. not homered yet? A forensic swing investigation. Driveline Baseball. https://www.drivelinebaseball.com/2026/05/fernando-tatis-jr-no-home-runs-swing-investigation/
Cherryhomes, K. (2026 May). Causal Analytics Deconstruction of Fernando Tatis Jr. [Unpublished manuscript]. X Factor Technology.
Cherryhomes, K. (2026 May). Collision State Correlation Analysis II [Unpublished manuscript]. X Factor Technology.
MLB Statcast. (2026). Play-by-play and batted ball data via Baseball Savant. https://baseballsavant.mlb.com