
Why (and how) I think the Brewers Will Beat the Dodgers in the NLCS
By Ken Cherryhomes ©2026
The Prediction and the Offensive Contrast
It’s easy to look at wins and losses and decide which team should advance in October. It’s also easy to look at home runs and slugging percentage and assume the more powerful offense holds the advantage. Milwaukee complicates both assumptions. The National League field leaves open the possibility of another matchup, including Milwaukee and Chicago, but my prediction is that the Brewers and Dodgers will be the two teams left to decide the NLCS. The Brewers finished with baseball’s best record while building an offense that doesn’t depend on home-run volume. Their profile reflects something broader: disciplined swing decisions, high-quality collisions, elite on-base performance, aggressive advancement, and preservation of outs. Those characteristics form the offensive structure that I think will separate Milwaukee from Los Angeles if that matchup decides the National League championship.
The Causal Analytics Profile
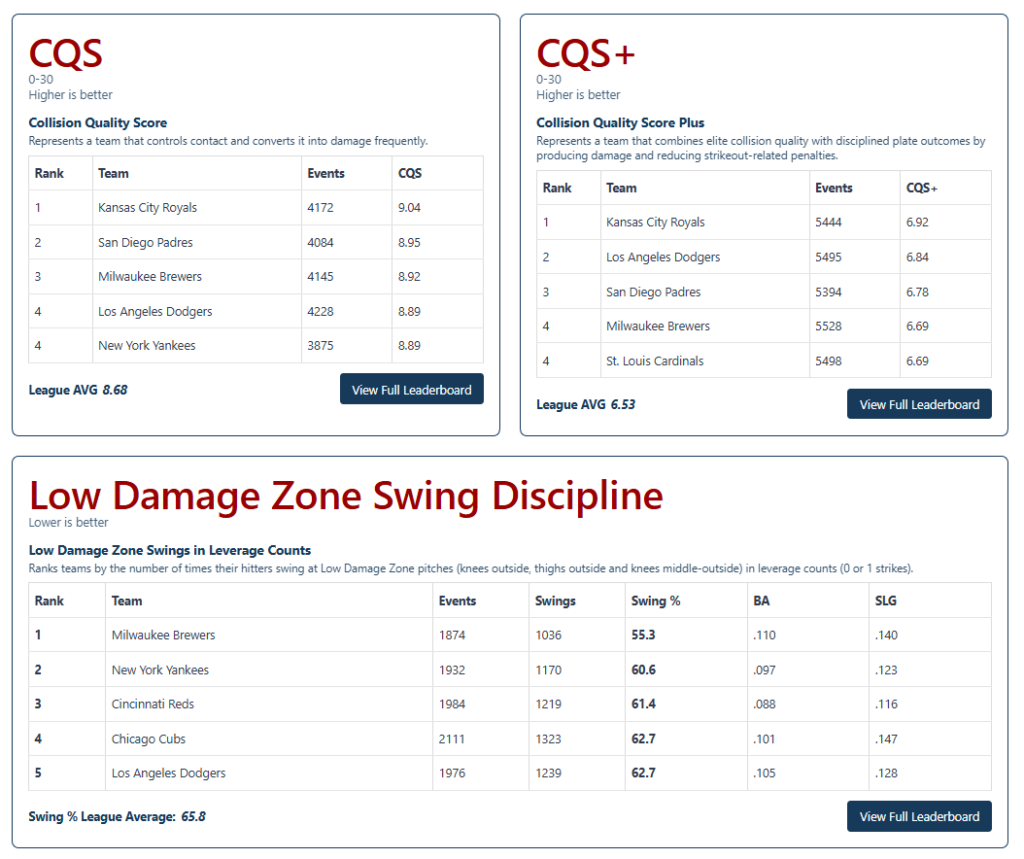
The first place to look is the Causal Analytics standings. Causal Analytics Summary Leaderboard – X Factor Technology. Milwaukee ranks third in Collision Quality Score, fourth in Collision Quality Score Plus, and first in Low Damage Zone swing discipline. Taken together, those measures describe an organization producing high-quality contact, preserving that quality after strikeouts are incorporated, and avoiding a disproportionate number of low-value swing decisions in leverage counts. Low Damage Zone discipline evaluates swings in the knees-outside, thighs-outside, and knees-middle-outside regions while still counting out-of-zone pitches when the hitter chooses to attack them. Milwaukee’s 55.3% Low Damage Zone swing rate is 10.5 percentage points below the 65.8% league average, the best mark in Major League Baseball, and reflects more than passive plate discipline. It reflects a roster-wide pattern of refusing poor collision opportunities while maintaining elite collision quality when swings are taken.
In leverage counts with zero or one strike, the pitcher cannot terminate the plate appearance with a strikeout on the next pitch, but the hitter can terminate it by voluntarily offering at a pitch and putting a poor collision into play. That asymmetry gives the hitter substantial control over whether a Low Damage Zone pitch becomes an offensive event. Swinging at those locations in leverage counts therefore surrenders count leverage that the hitter is not yet required to surrender. With two strikes, the problem changes: the hitter must defend a wider portion of the zone, and strikeout cost becomes part of the survival problem.
Milwaukee’s 55.3 percent Low Damage Zone swing rate reflects a roster-wide refusal to donate that leverage prematurely. Los Angeles holds the stronger CQS+ position once strikeouts are incorporated, while Milwaukee holds the advantage in CQS and Low Damage Zone discipline. The Brewers therefore distinguish themselves not by winning every component of the collision profile, but by combining elite collision quality with unusually selective engagement before survival counts force the hitter to defend the margins.
At the individual level, that profile could belong to one hitter. Across a full Major League roster and an entire season, however, the same decision pattern repeated by multiple hitters and reinforced by top-tier collision metrics changes the inference. Repetition across independent players reduces the likelihood that the pattern reflects one hitter’s tendencies, while persistence across a full season reduces the likelihood that it reflects a short-term fluctuation. When those same decision behaviors also align with strong team-level collision quality, the evidence converges on a shared offensive approach. The Brewers’ hitters repeatedly make similar decisions about which pitch locations deserve commitment, and the resulting contact quality reinforces the same offensive philosophy. That consistency marks a system rather than accident or randomness.
The first place to look is the Causal Analytics standings. Causal Analytics Summary Leaderboard – X Factor Technology. Milwaukee ranks third in Collision Quality Score, fourth in Collision Quality Score Plus, and first in Low Damage Zone swing discipline. Taken together, those measures describe an organization producing high-quality contact, preserving that quality after strikeouts are incorporated, and avoiding a disproportionate number of low-value swing decisions in leverage counts. Low Damage Zone discipline evaluates swings in the knees-outside, thighs-outside, and knees-middle-outside regions while still counting out-of-zone pitches when the hitter chooses to attack them. Milwaukee’s 55.3% Low Damage Zone swing rate is 10.5 percentage points below the 65.8% league average, the best mark in Major League Baseball, and reflects more than passive plate discipline. It reflects a roster-wide pattern of refusing poor collision opportunities while maintaining elite collision quality when swings are taken.
In leverage counts with zero or one strike, the pitcher cannot terminate the plate appearance with a strikeout on the next pitch, but the hitter can terminate it by voluntarily offering at a pitch and putting a poor collision into play. That asymmetry gives the hitter substantial control over whether a Low Damage Zone pitch becomes an offensive event. Swinging at those locations in leverage counts therefore surrenders count leverage that the hitter is not yet required to surrender. With two strikes, the problem changes: the hitter must defend a wider portion of the zone, and strikeout cost becomes part of the survival problem.
Milwaukee’s Low Damage Zone swing rate reflects a roster-wide refusal to donate that leverage prematurely. Los Angeles holds the stronger CQS+ position once strikeouts are incorporated, while Milwaukee holds the advantage in CQS and Low Damage Zone discipline. The Brewers therefore distinguish themselves not by winning every component of the collision profile, but by combining elite collision quality with unusually selective engagement before survival counts force the hitter to defend the margins.
That does more defensive work for you because it explains exactly why the count definition exists, acknowledges the Dodgers’ CQS+ advantage, and avoids making a pitcher-response claim you haven’t yet demonstrated.
At the individual level, that profile could belong to one hitter. Across a full Major League roster and an entire season, however, the same decision pattern repeated by multiple hitters and reinforced by top-tier collision metrics changes the inference. Repetition across independent players reduces the likelihood that the pattern reflects one hitter’s tendencies, while persistence across a full season reduces the likelihood that it reflects a short-term fluctuation. When those same decision behaviors also align with strong team-level collision quality, the evidence converges on a shared offensive approach. The Brewers’ hitters repeatedly make similar decisions about which pitch locations deserve commitment, and the resulting contact quality reinforces the same offensive philosophy. That consistency marks a system rather than accident or randomness.
Session Three Round Two – 8 swings 90-92mph (one errant pitch #7)
The Power Gap
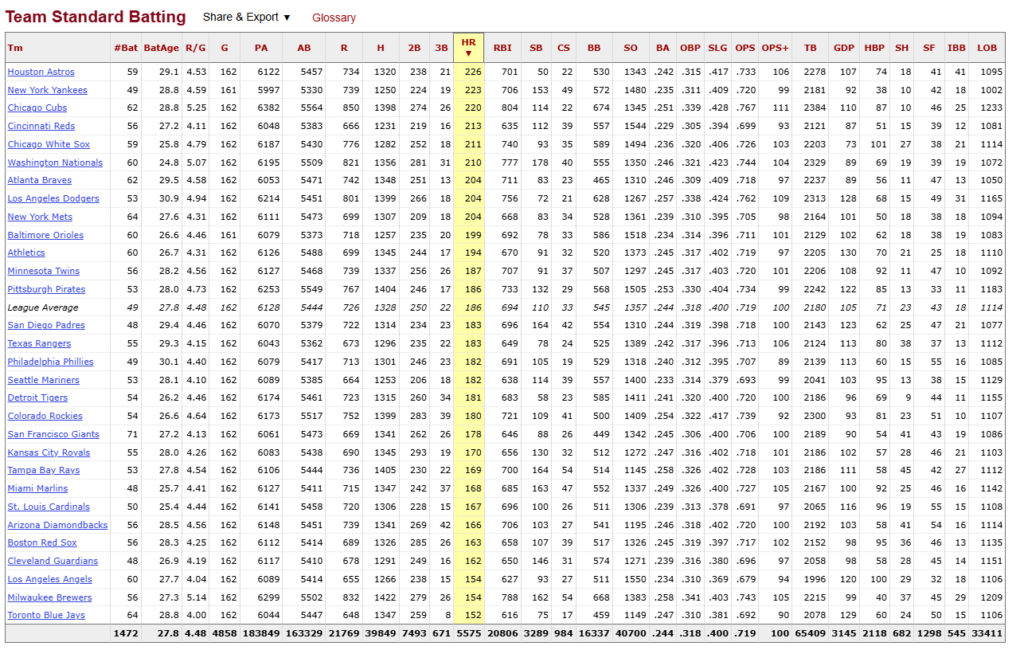
The conventional power numbers make the Brewers even more interesting. Milwaukee hit only 154 home runs, second from the bottom in Major League Baseball, while Los Angeles hit 204. The Dodgers produced 50 more home runs than Milwaukee, a substantial advantage if home-run production is treated as the primary measure of offensive strength.
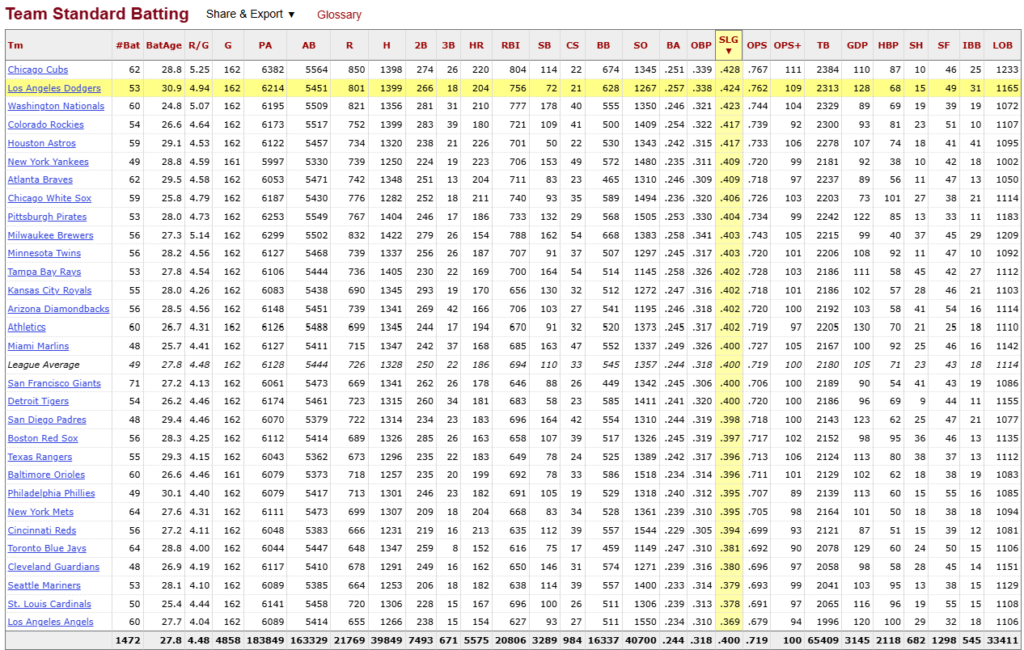
The same contrast appears in slugging percentage. Los Angeles finished at .424, while Milwaukee finished at .403. The Dodgers clearly possess the stronger conventional power profile. They hit more home runs and generated considerably more total-base value per at-bat through slugging, yet that power advantage didn’t translate into more runs.
More Runs With Less Power
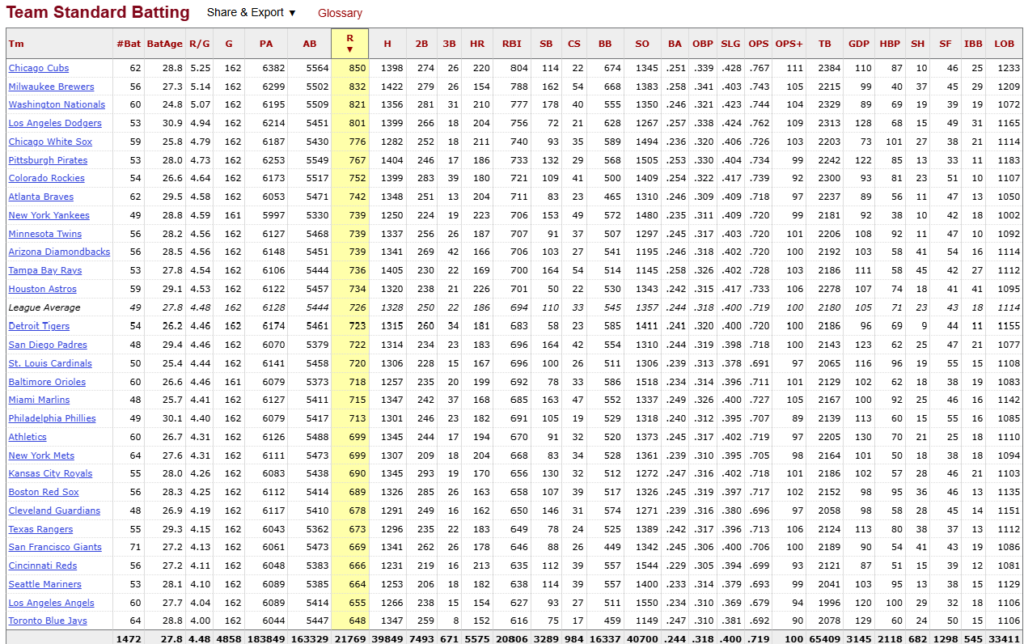
Milwaukee scored 832 runs. Los Angeles scored 801. The Brewers scored 31 more runs while hitting 50 fewer home runs and posting the lower slugging percentage. That contrast defines the offensive argument. Los Angeles generates a greater share of its offensive value through power, while Milwaukee creates runs through a broader system that doesn’t require the long ball to function.
On-Base Pressure
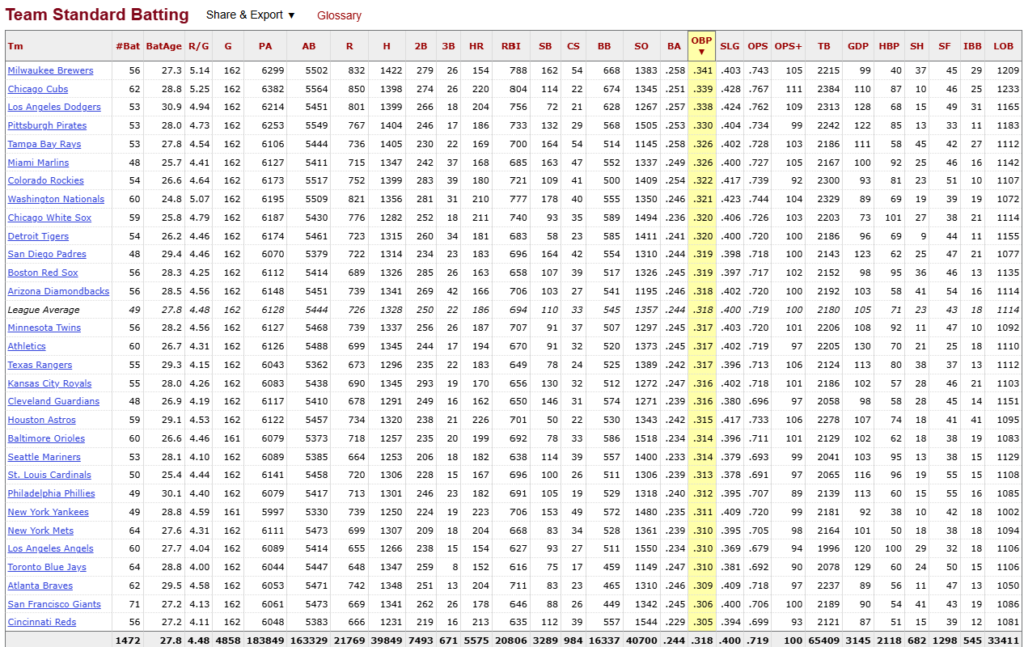
The foundation is on-base percentage. Milwaukee led Major League Baseball with a .341 OBP, giving the Brewers more opportunities to create run-producing situations before power even enters the equation. Reaching base at that rate creates the raw material for everything that follows, but Milwaukee doesn’t simply leave those runners stationary and wait for another hitter to drive them home.
Baserunning Leverage and Out Preservation
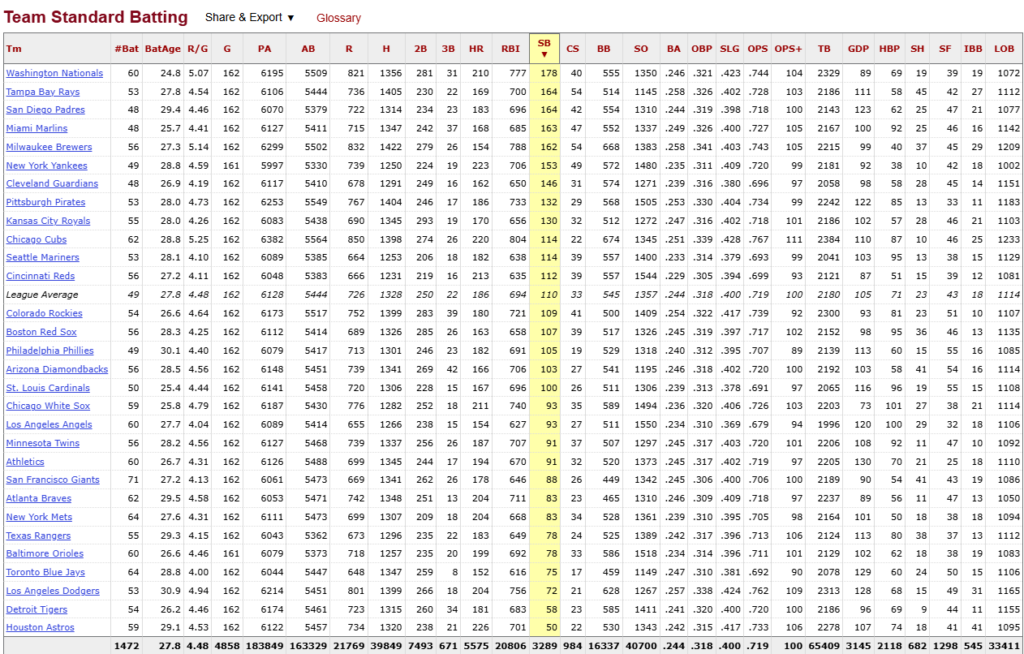
The Brewers stole 162 bases while the Dodgers stole 72. That 90 base margin came with an aggressive profile: Milwaukee was caught stealing 54 times compared to 21 for Los Angeles, consuming 33 additional baserunning outs at a 75.0 percent success rate. In isolation, conventional accounting might view those 33 outs as counterproductive to out preservation. Across a full offensive system, however, that aggressive volume created a net positive exchange that paid out twice.
Advancing from first to second places a runner into scoring position without requiring another collision, reduces the damage threshold demanded of the next hitter, and turns a subsequent single into a run-scoring event rather than a station to station advance. Just as important, vacating first base systematically dismantles force play geometry at second. By moving runners before the next batted ball, Milwaukee grounded into 29 fewer double plays than Los Angeles (99 to 128). Those 29 avoided double plays saved 29 potential second outs that would have terminated rallies, comfortably absorbing the caught stealing margin while continually shifting defensive leverage back onto the pitcher. Milwaukee’s baserunning is not reckless theft; it is an active mechanism that manufactures scoring position while simultaneously shielding innings from two out ground ball events.
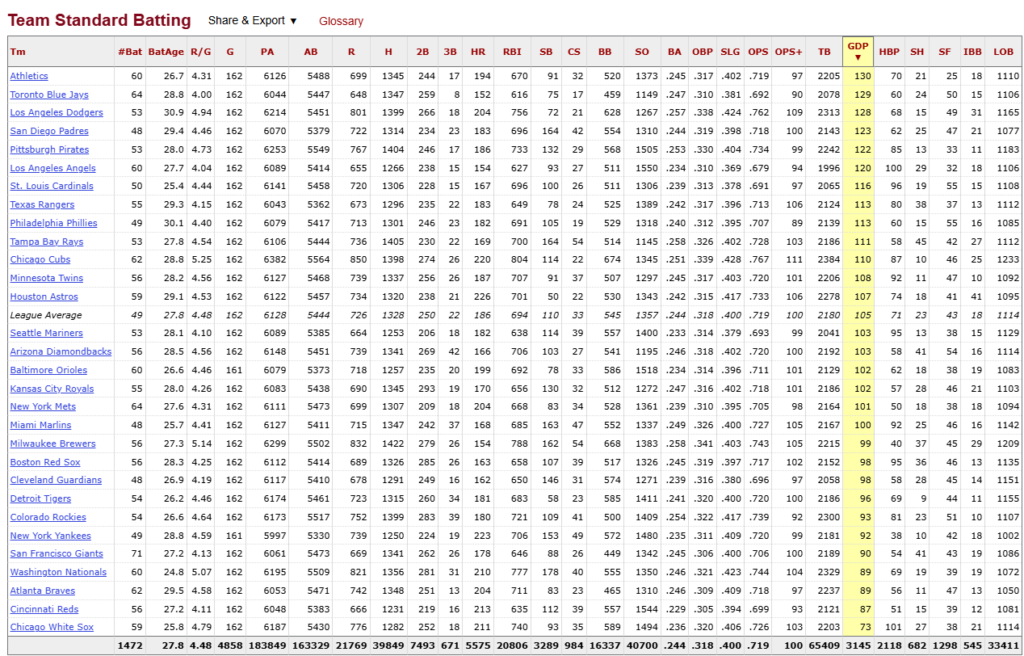
The double-play numbers fit directly into that structure. Milwaukee grounded into 99 double plays compared with 128 for Los Angeles. Milwaukee’s aggressive baserunning directly reduces double-play exposure by moving runners off first and removing the force at second before subsequent ground balls are put in play, while team speed places additional pressure on the defense to complete two outs. Milwaukee therefore combines a league-leading ability to put runners on base with aggressive advancement and fewer innings damaged by two outs occurring on a single batted ball.
What the Causal Metrics Explain
This is where the Causal Analytics standings explain something the conventional numbers describe only after the fact. On-base percentage, stolen bases, double plays, runs, home runs, and slugging tell us what Milwaukee produced. Collision Quality Score, Collision Quality Score Plus, and Low Damage Zone discipline begin identifying the behaviors underneath those results. Milwaukee selectively commits swings, produces high-quality collisions from those decisions, and remains among baseball’s best collision teams even when strikeouts are incorporated into the evaluation.
The Low Damage Zone result is particularly revealing at the institutional level. Milwaukee leads baseball in avoiding swings at locations associated with poor damage opportunities during leverage counts. The definition doesn’t reward hitters simply for taking obvious balls outside the strike zone. Those pitches are excluded when taken, but they return to the event population when the hitter chooses to swing. The metric therefore preserves the penalty for poor expansion while removing routine takes that provide little evidence of meaningful discipline.
That roster-wide behavior connects naturally with the collision-quality rankings. The Brewers aren’t simply taking more pitches and hoping for walks. Their hitters are refusing poorer collision opportunities while ranking among baseball’s best teams when collisions actually occur. Milwaukee ranks third in Collision Quality Score, one position ahead of Los Angeles, while Los Angeles ranks second in Collision Quality Score Plus and Milwaukee ranks fourth once strikeouts are incorporated. Both clubs therefore maintain elite collision profiles, but Milwaukee pairs that collision quality with the strongest Low Damage Zone discipline in Major League Baseball.
Los Angeles presents a different model. The Dodgers possess the more obvious damage weapon. Their 204 home runs and .424 slugging percentage give them greater capacity to change the score immediately with one swing. That power remains dangerous, but it also represents a larger share of the offensive distinction between the two teams. Milwaukee has already demonstrated that it can score more runs without matching Los Angeles in either home runs or slugging.
Postseason Pitching Environment and Causal Countermeasures
The matchup becomes more favorable to Milwaukee when run creation has to come through more than one pathway. Postseason baseball systematically compresses damage opportunities. With rotations shortened, leverage bullpens deployed earlier, and average fastball velocity ticking upward, pitchers donate far fewer mistakes in the heart of the plate. Milwaukee (3.51 ERA, 120 ERA+) and Los Angeles (3.55 ERA, 120 ERA+) enter the postseason with statistically even run-prevention profiles, so the decisive battle shifts to how each offense interfaces with elite pitching rather than which staff holds the edge.
An offense reliant on home-run volume suffers disproportionately in that environment because high-velocity arms attack peripheral zones to induce weak contact. Milwaukee’s Low Damage Zone discipline functions as a direct countermeasure to that strategy. By refusing perimeter pitches early in counts (knees-outside, thighs-outside, and knees-middle-outside), the Brewers reduce a pitcher’s ability to steal strikes and generate early-count weak contact. They force high-leverage arms deeper into counts, expanding opportunities to draw walks or compel the pitcher back toward the zone where quality collisions occur.
When clean power opportunities narrow, Milwaukee retains multiple ways to manufacture bases and protect outs. The Brewers reach base at a league-leading .341 rate, advance runners without requiring sequential hits, eliminate force plays at second base, and minimize double plays while maintaining top-tier collision quality on the pitches they choose to attack. The Dodgers can punish mistakes with power. Milwaukee creates sustained pressure through swing discipline, baserunning leverage, and collision execution even when the long ball is taken off the table.
Why I’m Picking Milwaukee
That’s why I think the Brewers will beat the Dodgers in the NLCS, and how they’ll accomplish that. Los Angeles will bring more slugging. Milwaukee will bring more ways to create the next run.