
Causal Analytics Metrics 2026: 50-Game Rankings
By Ken Cherryhomes ©2026
Causal Analytics begins where traditional hitting metrics lose the signal: at the collision.
Most hitting metrics grade the aftermath. They measure the ball after it leaves the bat, then work backward through averages, probabilities, and historical comparisons. Causal Analytics reverses that order. It evaluates whether the hitter solved the collision problem first, then measures how force and outcome behaved after that collision state was established.
That distinction matters. A hard-hit ball is not automatically good contact. A hit is not automatically correct contact. An out is not automatically failed contact. At the collision level, the question is more precise: did the hitter meet the pitch at a contact depth and spray direction commensurate with the pitch location?
The 50-game rankings presented here are built from that premise. CGD identifies collision correctness. CGD-HH identifies hard-hit contact that remains valid inside the expanded power-band or intent-zone tolerance. CQS identifies the best total contact profile by combining geometry, force, and outcome value.
Together, these metrics do not simply rank production. They identify hitter type. They separate the consistent contact hitter from the power hitter, the wasted-power hitter from the power-plus-consistency hitter, and the complete offensive profile from the outcome-dependent one.
CGD: Collision Geometry Deviation
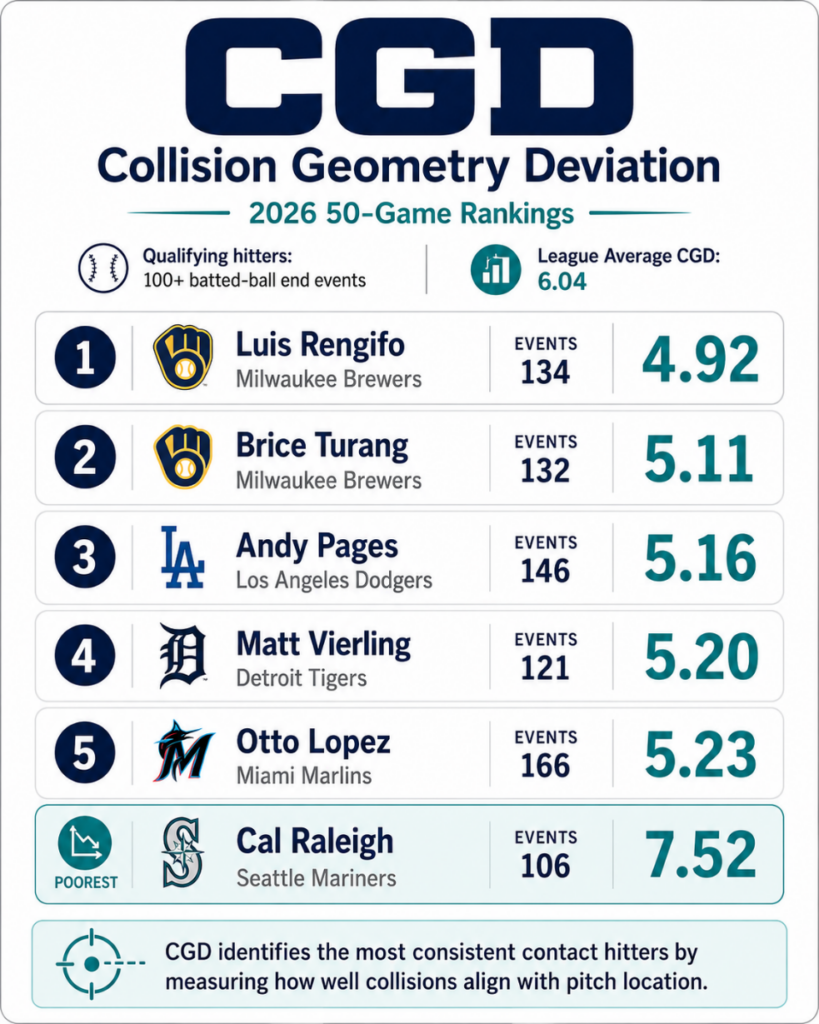
CGD is the base collision-level metric. It evaluates whether the hitter’s contact was commensurate with pitch location through the relationship between pitch location, contact depth, and spray direction.
CGD is intentionally strict because it evaluates the hitter’s base swing-arc solution independent of EV, LA, hit type, and outcome. Each pitch location carries an expected collision window along the hitter’s swing arc, with contact depth and spray direction linked by the geometry of that location. A hitter can hit a ball hard and still score poorly in CGD if the collision occurred outside the pitch-location solution. A hitter can also make an out and still score well if the collision matched the expected contact-depth and spray-direction relationship, but the result failed after contact.
Scoring parameters: CGD is scored from 0 to 10. A score of 0 is perfect. Lower is better. Scores are grouped into Optimal, Very Good, Good, Fair, and Poor buckets.
Hitter type revealed: CGD identifies the consistent contact hitter. Top CGD hitters control the collision, match spray direction to pitch location, and show stable contact-depth discipline. These hitters are not necessarily the loudest bats, but they are the cleanest collision solvers. Low-ranking CGD hitters show forced contact, poor pitch-location discipline, mistimed contact depth, or intent overriding the pitch-location solution.
What CGD exposes: CGD reveals whether a hitter’s contact profile is built on repeatable collision correctness or whether the hitter is surviving through force, or occasional compensatory success.
Once the hitter demonstrates command of the base collision, intent can be effectively applied as a second-order objective. At that point, the question is no longer whether the hitter can simply match the pitch-location solution, but whether he can broaden the swing arc through the power band, attack a specific intent zone, or apply lofted damage intent to pitches that afford it, without abandoning the collision requirements that make the swing valid in the first place.
CGD-HH: Hard-Hit Collision Geometry Deviation
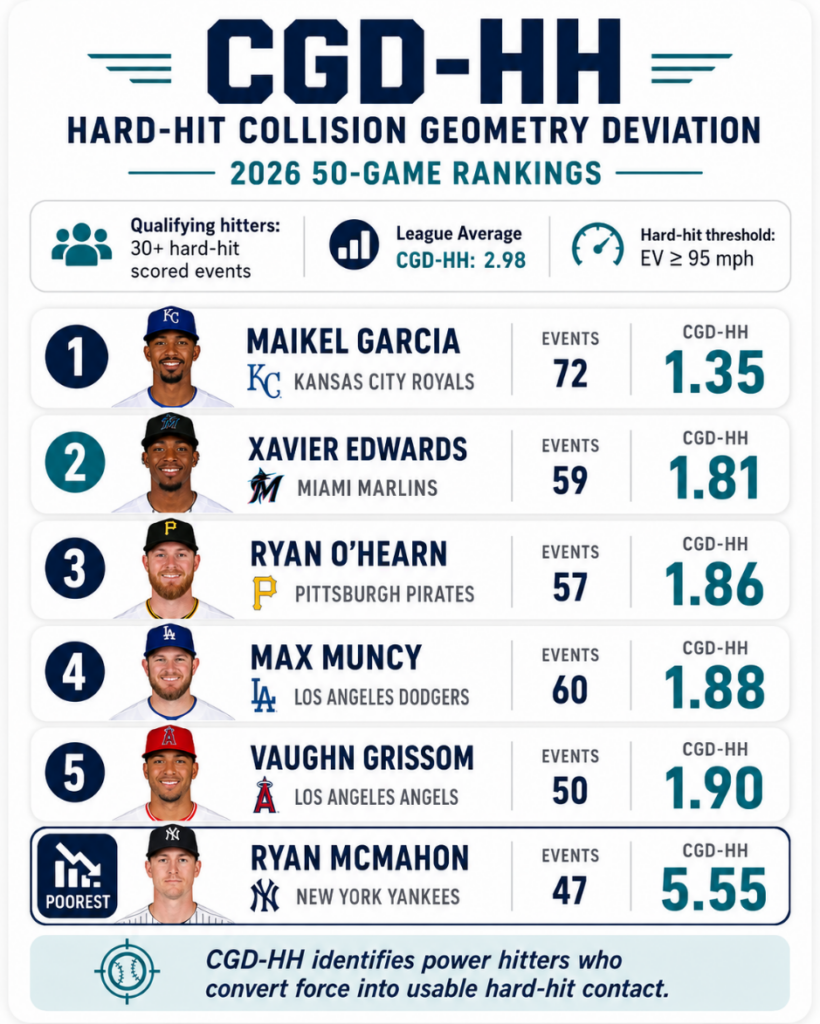
CGD-HH is the hard-hit, power-adjusted extension of CGD. It applies only to contact events with EV ≥ 95 mph.
CGD-HH recognizes that high-energy contact often requires broadening the swing arc through the power band “intent zone” (middle-inside to middle-outside, thighs to numbers). Under those conditions, a hitter can deviate from strict CGD and still remain inside a valid expanded tolerance. That distinction is important. CGD-HH is not hard-hit rate. It does not merely count force. It evaluates whether hard contact remained geometrically usable.
Scoring parameters: CGD-HH is scored from 0 to 10. A score of 0 is perfect. Lower is better. Scores are grouped into Optimal, Very Good, Good, Fair, and Poor buckets.
Hitter type revealed: CGD-HH identifies the power hitter who is applying force through intent. Top CGD-HH hitters convert force into valid hard-hit contact by broadening their swing arc. They are not simply producing EV; they are producing EV inside a collision window that supports usable power. Low-ranking CGD-HH hitters are wasted-power hitters. They hit the ball hard, but their hard contact is often misaligned, producing loud outs, hard ground balls, or suppressed production through opposite-field conversion within the power band.
What CGD-HH exposes: CGD-HH separates real power from raw force. It shows whether high EV is supported by a valid collision pattern or whether force is masking geometric failure.
CQS: Contact Quality Score
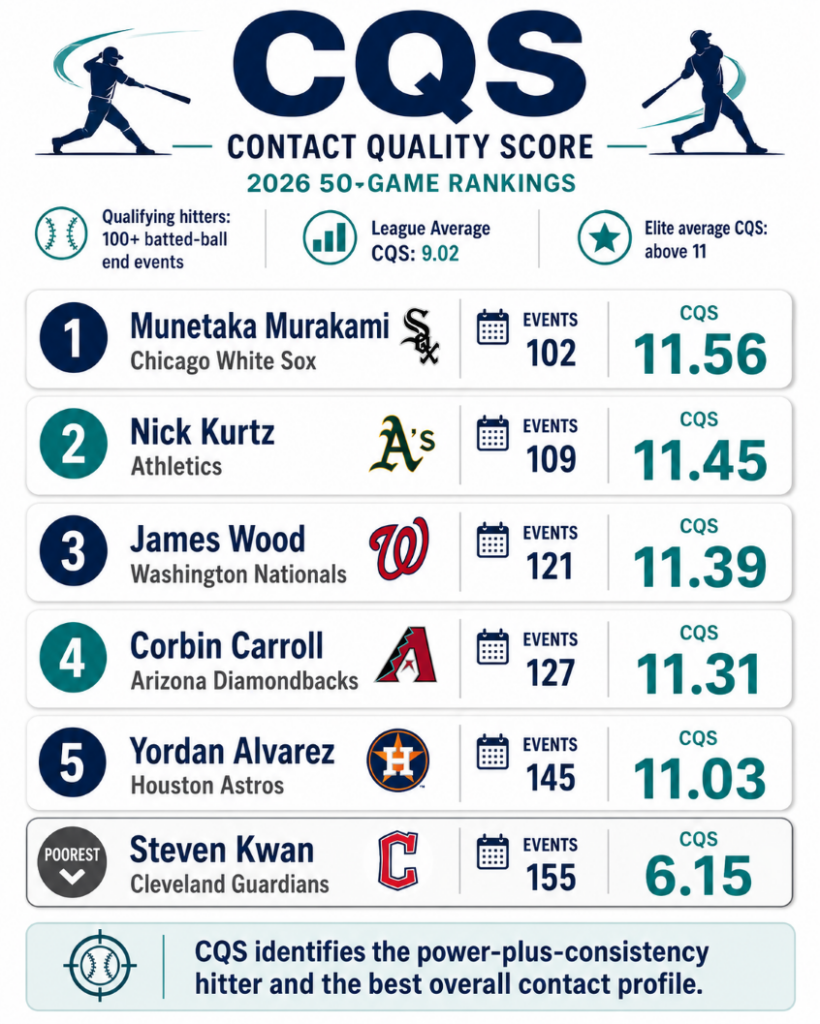
CQS is the four parameter, weighted contact-quality score built on top of CGD and CGD-HH. It combines CGD, CGD-HH, exit velocity, and outcome/hit type into one total contact-quality score.
CQS does not replace CGD or CGD-HH. It uses them as the foundation. CGD carries the greatest weight. CGD-HH adds the hard-hit power-band layer. EV supplies the force layer. Outcome defines the hit type but carries the lowest weight, preventing the score from collapsing into another result-based metric.
Scoring parameters: CQS is scored on a 0–30 event scale, with 30 representing a perfect single-event score. Higher is better.
CQS rankings are based on each hitter’s average score across all qualified contact events. The 0–30 scale applies to individual events, not season-average expectations. Through the 50-game sample, qualified batters with end events ≥ 100 produced an MLB average CQS of 9.02.
Hitter type revealed: CQS identifies the power-plus-consistency hitter. These are the elite hitters, the best overall contact-quality hitters in the framework. They combine collision control, valid hard-hit contact, force, and enough result value to separate from one-dimensional profiles.
What CQS exposes: CQS identifies the overall best hitter profile while also separating repeatable contact quality from episodic outlier success. CGD shows who controls the collision. CGD-HH shows who converts force into usable power. CQS shows who combines both into the best total contact profile. Isolated outlier events can survive within the score when samples remain small, but as the sample grows, the aggregate ranking weeds out hitters whose value depends on rare compensatory outcomes rather than repeatable collision quality.
How to Decipher the Rankings
The rankings should not be expected to match.
CGD ranking identifies the best consistent contact hitters.
CGD-HH ranking identifies the best power hitters.
CQS ranking identifies the elite hitters, the power-plus-consistency profiles.
A hitter can rank highly in CGD-HH because they dominate the power band or hunts inside-pitch opportunities for lofted pull collisions, but that profile may or may not survive in CQS depending on pitch-selection discipline. If the hitter attacks the inner third with discipline and does not force the same intent onto pitches that require a different solution, the power profile can carry into CQS. If the hitter expands, misapplies pull-side intent, or produces weak geometry outside the hunted lane, the CGD-HH advantage is reduced in the aggregate. Another hitter may not lead CGD-HH, but may rank highly in CQS because he combines stable geometry, usable hard contact, EV, outcome value, and disciplined pitch selection across a broader contact profile.
That separation is the point. The metrics expose hitter identity rather than reducing every player to one generic offensive grade.
Team-Level Interpretation
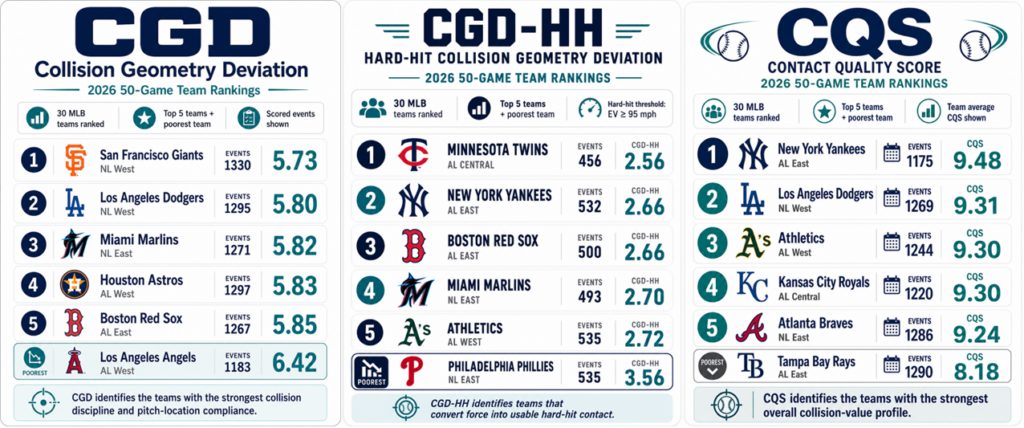
The same structure applies to team scoring.
- A team with strong CGD scores may be showing a systemic emphasis on pitch-location discipline, contact-depth control, and field usage.
- A team with strong CGD-HH scores may be showing a systemic emphasis on power-band intent, pull-side damage, and hard-contact conversion.
- A team with strong CQS scores may be showing the most complete offensive profile: collision correctness, power conversion, force, and production working together.
- A team with poor CGD but strong CGD-HH may be built around aggressive power intent.
- A team with strong CGD but weaker CGD-HH may show contact discipline without enough force conversion.
- A team with strong CQS is the most complete offensive group within the collision-level framework.
This is where the rankings move beyond individual player evaluation. If the numbers cluster by team, they may reveal organizational hitting identity. They may show whether a club’s offensive system is producing disciplined collision patterns, power-band aggression, force without alignment, or a complete blend of geometry and production.
Conclusion
Causal Analytics changes the evaluation point. Traditional metrics begin after the collision, then attempt to explain the hitter through averages, outcomes, and probabilities. These evaluations begin at the collision itself, where timing, pitch location, contact depth, spray direction, force, and result first become causally connected.
Descriptive metrics and regressive models often compress different causes into the same statistical category. Two hitters can produce the same exit velocity, launch angle, hard-hit rate, BABIP, or xwOBA profile while arriving there through entirely different collision patterns. One may be controlling pitch-location geometry. Another may be surviving through force. Another may be benefiting from episodic outliers. Traditional metrics tend to describe the shared result. Causal Analytics separates the event structure that produced it.
The 50-game rankings are therefore not simply production rankings. They are collision-level identity rankings. CGD shows whether the hitter controls the base collision. CGD-HH shows batter intent, and whether hard-hit contact survives inside the expanded power-band tolerance. CQS shows whether the hitter combines collision control, usable force, pitch-selection discipline, and outcome value into a repeatable contact profile.
This is also why the three metrics’ rankings should not be expected to match. A hitter can lead one layer and fail to survive the aggregate. A power-band hunter may score well in CGD-HH, but if he expands, forces pull-side intent, or loses contact quality outside his preferred lane, that strength is reduced in CQS. Another hitter may not lead the hard-hit layer but may separate through broader collision control, disciplined lane selection, and stable force production.
The same structure gives rolling 10-game evaluations their value. Movement in CGD, CGD-HH, or CQS is not treated as generic hot-and-cold variance. It becomes a diagnostic signal. Changes can be traced through pitch type, velocity, location, spray direction, EV, and outcome to determine whether the hitter changed, the attack pattern changed, or the collision profile itself began to break down.
At the team level, the rankings can test whether these patterns are individual or systemic. A club’s profile may reveal collision discipline, power-band aggression, lane hunting, whole-field coverage, force without alignment, or a complete blend of geometry and production. That moves the evaluation from player output to organizational hitting identity.
The larger implication is that collision-level analysis preserves structure that public averages erase. Average collision depth, average EV, average launch angle, and outcome probabilities compress the hitter’s contact pattern into summary values. They do not show where the swing is solving or failing inside the pitch-location matrix. A single contact-depth average cannot distinguish forward contact on inner-half pitches from late-depth contact on the outer half. Nor can it show how those patterns change by velocity band, pitch type, spray window, or scoring layer. By keeping those relationships attached to the collision event, Causal Analytics allows functional swing-shape signatures to emerge: broad arcs, narrow arcs, inside-lane power profiles, opposite-field contact profiles, steep vertical or horizontal barrel-entry tendencies, and other repeatable collision earmarks.
That is the purpose of these rankings. They do not stop at who produced. They identify how production was built, whether the pattern is stable, and whether the underlying collision behavior belongs to the hitter, the opponent’s attack, or the team’s broader hitting philosophy.