Deconstructing Tatis Jr. From the Collision Level Through Causal Analytics: A 40-Game Collision-Level Analysis of Fernando Tatis Jr.
By Ken Cherryhomes ©2026
At the 2026 SABR Analytics Convention in Phoenix, we introduced Causal Analytics and its foundational metrics, CGD and CGD+. CGD, Collision Geometry Deviation, evaluates collision-quality adherence by grading whether batted ball spray direction remained geometrically commensurate with pitch location. Using a small 2025 postseason sample from Shohei Ohtani and Vladimir Guerrero Jr., we demonstrated that meaningful collision-level patterns emerge even in limited datasets. We concluded that strong analytical signal begins stabilizing at roughly 200 swings, substantially faster than metrics such as xwOBA and with greater predictive utility than regressive statistics like BABIP. We also referenced advanced causal metrics still in development, including CGD-HH and CQS, without publicly detailing them.
CGD-HH, graded on a 0-10 scale with 0 representing optimal alignment, evaluates whether hard-hit contact maintained geometrically coherent collision alignment relative to pitch location and expected spray affordances under force-production conditions. CQS, scored on a 0-30 scale with 30 representing optimal collision quality, integrates collision-level evaluations with force-production and descriptive outcome characteristics into a unified collision-quality framework.
We are now collecting collision-level data and performing causal evaluations for every swing taken by every hitter across all thirty MLB teams during the 2026 season. This paper narrows that framework to a focused 40-game analysis of Fernando Tatis Jr., examining how elite force production can persist alongside complete power suppression when collision geometry and swing intent begin to diverge.
Fernando Tatis: The Force-Damage Paradox
Forty games into the 2026 season, Fernando Tatis Jr. presents a contradiction that conventional sabermetric models struggle to explain. His hard-hit rates remain among the highest in baseball, and his exit velocities show no evidence of diminished bat speed or physical deterioration. Through the early 2026 sample covering Fernando Tatis Jr.’s first 40 games, public Statcast reporting continued to show elite force-production metrics despite complete home-run suppression. His Hard-Hit Rate sat at 56.6%, placing him among the league’s elite hard-contact hitters, while his average exit velocity remained strong at 92.1 mph. The data reinforces the central paradox of his early 2026 season: Tatis continued generating upper-tier force, but the lack of forward contact depth and efficient vertical launch geometry neutralized his over-the-fence power. The failure point becomes immediately visible in the aggregate outcomes: zero home runs and only six extra base hits, accompanied by a sharply elevated ground-ball rate. Despite this collapse in power production, Tatis continues generating elite force against premium velocity, including four-seam fastballs and sinkers averaging 97 mph. The underlying capability for power remains fully intact.
The standard industry response is to dismiss this type of profile as an insignificant forty-game slump, bad luck on balls in play, or temporary timing variance expected to self-correct naturally. But labeling this as luck obscures a structural decoupling between force production and damage conversion. Tatis is still generating violent kinetic force, which confirms the on-time swing decisions, but that force is no longer consistently connected to the collision geometry or spray angle profile required for lofted damage. The failure point requires a granular, collision-level evaluation of how the bat is actually intercepting the baseball.
Traditional analytical models often interpret elite exit velocity paired with weak outcomes as statistical variance. If that were truly the case, the collision patterns would appear noisy and inconsistent across swing layers. Instead, the data reveals an unusually stable structural pattern. To identify the root cause, the collisions themselves must be evaluated at the collision level rather than through descriptive outcomes alone. Not all swings produce scored collision events. Whiffs and certain non-contact outcomes are excluded from CGD scoring, while CGD-HH evaluates only the hard-hit subset of scored collisions. As a result, swing totals, scored collisions, and hard-hit collision subsets operate as distinct analytical layers throughout the study.
This requires separating interception geometry from damage geometry. Interception geometry refers to the ability to meet the baseball in space on time and commensurate with the pitched ball’s location in the strike zone. Damage geometry refers to the specific barrel orientation and broadened swing arc required to convert force into lofted pull-side impact. A hitter can preserve interception while simultaneously suppressing the geometric conditions necessary for lofted power. The persistence of the pattern across the opening forty games strongly suggests a stable maladaptive collision strategy rather than random variance.
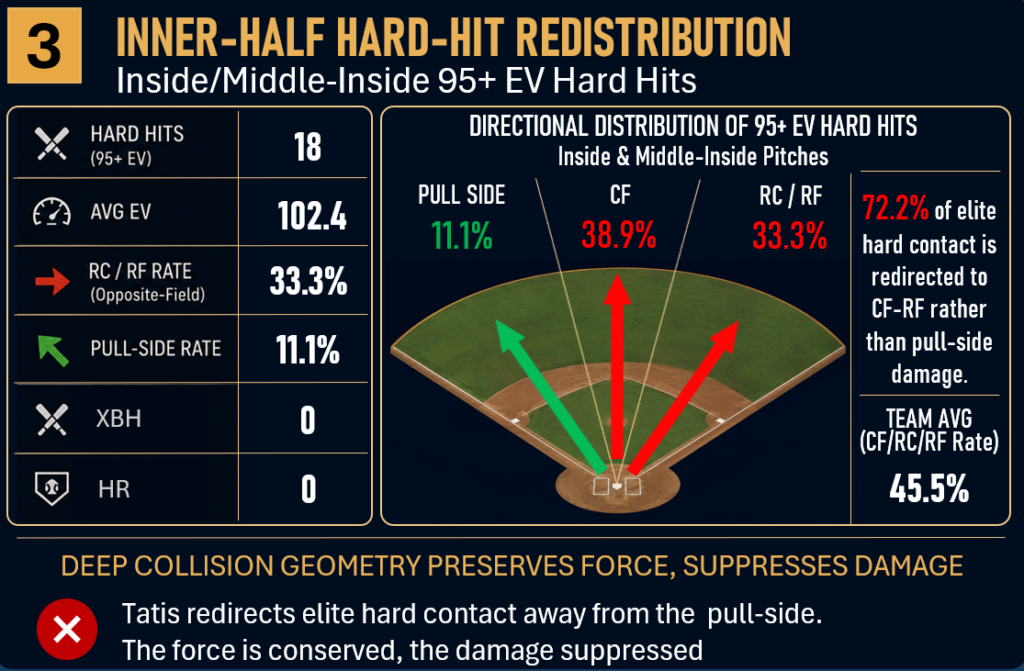
Strike-zone geometry is asymmetrical. Not every pitch location equally affords the broadened-arc collision geometry required for pull-side loft and home-run production. The primary damage band exists middle-inside through middle-outside locations from the thighs to the numbers. These regions provide the hitter the greatest spatial freedom to extend the barrel through collision while preserving launch-producing geometry. Within this damage band, Tatis is still producing a 70.5% hard-hit rate. He is correctly identifying hittable pitches and generating elite force against them. Under normal elite power-hitter geometry, these pitch locations, particularly the inside through middle-outside lanes should produce the greatest frequency of pull-side loft and forward-launch damage.
Instead, 72.2% of Tatis’s hard-hit balls on inside and middle-inside pitches are being directed toward center field, right-center, or the opposite field. Across the broader swing sample, 71.8% of all contacted swings in these same regions finish center or opposite field. The collision geometry itself is redistributing deeper into the zone. His average launch angle within this power region is only 10.5°, producing far less lofted damage than normally expected from elite-force collisions inside the primary damage corridor. The issue is not force production. The issue is that the highest-force collision tier is no longer occupying the broadened pull-side damage geometry normally associated with elite power.
The swing decisions reinforce the same pattern. Tatis is voluntarily engaging lower-zone strikes early in counts, particularly outside and middle-outside pitches at the knees, locations carrying some of the lowest damage affordances in the strike zone. The outcomes are severe. Across forty-one swings in these regions, he produced zero home runs. The paradox becomes more pronounced when comparing intent profiles. Tatis’s conservative center-field and opposite-field swings currently produce better launch angles and higher slugging percentages than his deliberate pull-side power attempts. The issue is not physical capability. The issue is that the geometry required to transform elite force into airborne damage is no longer being consistently achieved.
Tatis Jr. Through a Collision-Level, Causal Lens
To move beyond descriptive outcomes and properly identify the source of Fernando Tatis Jr.’s force-damage paradox, the evaluation must shift from traditional statistics to the collision level itself. Conventional sabermetric models primarily evaluate outcomes after contact, including batting average, slugging percentage, launch angle, and expected outcomes derived from exit velocity distributions. Causal Analytics approaches the problem differently. Instead of asking what happened after contact, it asks whether the collision itself occupied geometrically commensurate space relative to the pitch location attacked, whether hard-hit collisions expanded into expected damage geometry, and whether the collision behavior itself aligned with efficient damage-producing outcomes.
To isolate those relationships, the collisions themselves are evaluated through proprietary causal metrics designed to separately measure collision geometry compliance, hard-hit geometry behavior, and total collision quality independent of descriptive outcomes alone.
The first layer is Collision Geometry Deviation, or CGD. CGD measures whether the resulting spray direction remained geometrically commensurate with the pitch location attacked. A CGD score of 0 represents optimal collision geometry. Increasing scores represent increasing deviation from expected geometry relative to pitch location, independent of whether the hitter was attempting pull-side damage expansion or simply preserving collision compliance.
Through 40 games:
- Average CGD: 6.49
- CGD Distribution:
- 18 Optimal (0)
- 11 Very Good (2)
- 11 Good (4)
- 14 Fair (7)
- 53 Poor (10)
- CGD Compliant Collisions: 18 of 107 (16.8%)
That distribution is extraordinarily skewed toward poor collision geometry compliance. Nearly half of all scored collisions received the maximum deviation score of 10, indicating repeated spray-direction outcomes inconsistent with the geometrically commensurate spray behavior expected for the pitch locations attacked. This directly supports the spray-angle findings showing repeated concentration toward center field and the opposite field relative to the pitch locations being attacked.
The second layer is CGD-HH, which evaluates a different collision problem. While CGD measures geometric commensurability relative to pitch location, CGD-HH isolates only hard-hit collisions and evaluates whether high-force contact occupied the broader spray and launch affordances associated with intentional damage conversion inside the Power Band. Hard-hit collisions are not expected to behave identically to survival-contact geometry. When hitters recognize pitches inside the Intent Zone, they are no longer simply attempting interception. The hitter is expected to manage time well enough to apply a second-order damage objective by broadening the swing arc and expanding collision geometry toward pull-side damage space. CGD-HH therefore introduces broader tolerances reflecting expected hard-hit damage behavior under force-production conditions.
Through 40 games:
- Average CGD-HH: 4.16
- CGD-HH Distribution:
- 26 Optimal (0)
- 6 Very Good (2)
- 6 Good (4)
- 8 Fair (7)
- 17 Poor (10)
- CGD-HH Compliant Hard-Hit Collisions: 26 of 63 (41.3%)
That profile explains the paradox directly. The hard-hit frequency remains elite, but the directional conversion of that force repeatedly fails to produce broadened pull-side damage geometry. Instead of expanding into loft-producing pull-side launch space, the highest-force collisions continue redistributing toward center field and the opposite field.
Furthermore, his barrel-angle profile reinforces the same geometric pattern. If Tatis were repeatedly occupying efficient pull-side launch geometry, the barrel orientation profile would reflect forward-launch expansion and positive damage-producing collision behavior. Instead, the horizontal barrel-angle data shows a collision profile deeper into the zone with compensatory increased vertical bat angles.
Through 40 games:
- Average Horizontal Barrel Angle: -1.83°
- Median Horizontal Barrel Angle: -0.14°
For a hitter maintaining elite hard-hit rates and elite average exit velocity, a negative average horizontal barrel angle is extraordinarily revealing. The issue is not whether force is being generated. The issue is the orientation of the barrel at collision and the depth at which those collisions are occurring. That negative horizontal barrel-angle profile directly links the breakdown to the Power Band regions where Tatis should be producing his most efficient forward propagation and pull-side loft. The barrel-angle profile does not suggest an inability to stay on plane through collision. Instead, it suggests that collisions are occurring deeper in the zone with a more conserved horizontal barrel orientation than normally associated with airborne pull-side damage. Increased VBA may preserve collision alignment and keep the barrel on plane despite the deeper contact depth, but it does not restore the barrel extension and spatial expansion required for efficient launch conversion. This directly supports the CGD, CGD-HH, spray-angle, launch-angle, and contact-depth findings already established throughout the analysis.
The combined effect appears most clearly in Collision Quality Score, or CQS, the weighted causal metric integrating collision geometry, hard-hit geometry, force production, and descriptive outcomes into a single collision-quality evaluation.
Through 40 games:
- Average CQS: 9.23 out of 30
- Median CQS: 6.5
- Maximum CQS: 25
For a hitter maintaining elite average exit velocity and elite hard-hit rates, a 9.23 average CQS with a max score of 30 is extraordinarily low. The reason is straightforward. Force alone does not determine damage quality. The geometry and directional conversion of that force determine whether the collision actually becomes airborne pull-side damage.
The causal analytics layer therefore independently arrives at the same conclusion established by the leverage-count and spray-angle data.
The issue is not diminished force production. The issue is that the collision geometry itself is no longer repeatedly occupying efficient pull-side damage space. The behavioral decisions, spray distributions, launch-angle collapse, barrel-angle profile, CGD distributions, CGD-HH distributions, and CQS profile all converge on the same structural interpretation: the force remains elite, but the geometry converting that force into damage has degraded.
Approach and Leverage Count Swing Decisions
One of the central questions surrounding Fernando Tatis Jr. in 2026 is how a hitter capable of producing elite force can have zero home runs. His average exit velocity remains elite. His hard-hit rate remains among the best in baseball. The force is still present. The damage is not. To understand why, the first place to examine is his approach in hitter leverage counts, defined here as counts with one or fewer strikes. These are the counts where elite power hitters typically narrow swing decisions toward the regions of the strike zone most associated with airborne pull-side damage.
That region, referred to here as the power band, spans roughly middle-inside to middle-outside horizontally and thighs to numbers vertically.
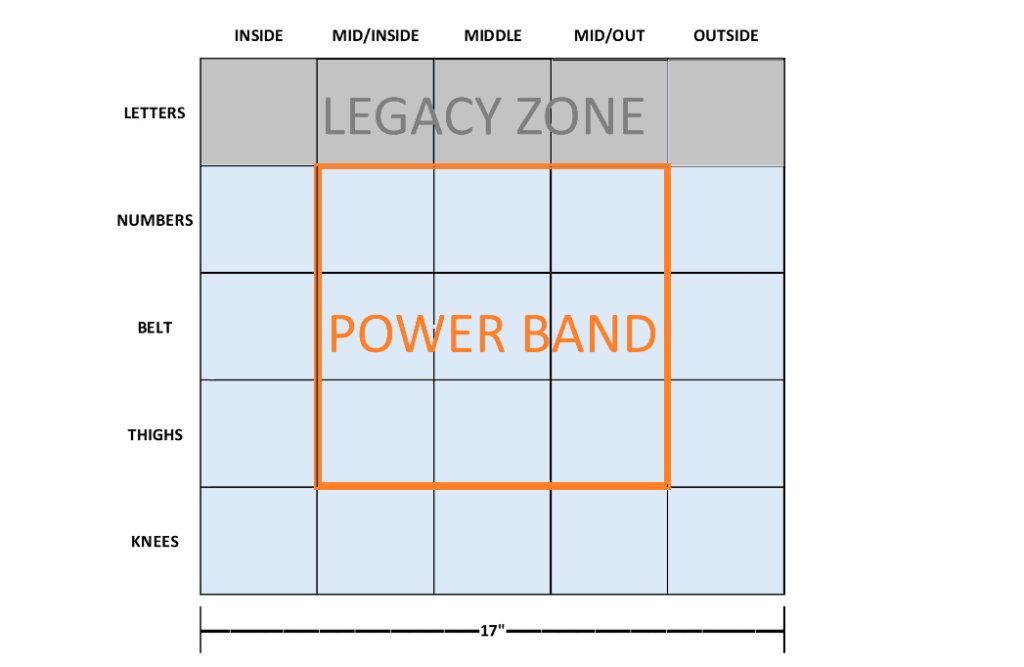
These locations allow the hitter to broaden the swing arc through collision, increasing angular momentum while promoting forward contact from an ascending barrel with more favorable attack angles, naturally supporting lifted contact profiles and pull-side damage conversion.
Tatis’s leverage-count swing profile, however, shows repeated aggression outside the power band, particularly lower in the zone and farther toward the outer half, where damage conversion historically deteriorates sharply.
In leverage counts:
- Outside pitches at the knees and thighs produced elevated whiff totals, repeated hard-hit outs, and virtually no meaningful extra-base damage despite strong force production.
- Middle-inside and inside pitches at the knees repeatedly produced rolled-over contact, grounded pull-side contact, and empty collision outcomes despite multiple hard-hit balls.
The spray-angle distribution reinforces the same structural pattern. Despite elite force production, many of these hard-hit collisions continue redistributing toward center field and the opposite field rather than converting into airborne pull-side damage.
The force itself has not disappeared:
- Middle pitches at the thighs produced 106.8 mph average exit velocity.
- Middle pitches at the knees produced 102.2 mph average exit velocity.
- Middle-outside pitches at the thighs produced 97.1 mph average exit velocity.
The extra-base-hit distribution strengthens the same conclusion. Through 40 games, Tatis produced only six extra-base hits despite maintaining elite hard-hit and average exit-velocity profiles.
Three of those extra-base hits originated from pitches located inside the power band:
- Middle-inside at the thighs produced an opposite-field triple at 85.7 mph exit velocity.
- Middle-outside at the thighs produced an opposite-field double at 108.3 mph exit velocity.
- Middle-outside at the belt produced a center-field double at 113.5 mph exit velocity.
The remaining three extra-base hits occurred outside the power band:
- Inside at the thighs produced an opposite-field double at 83.1 mph exit velocity.
- Middle at the knees produced a pull-side double at 108.7 mph exit velocity.
- Outside at the belt produced a left-center double at 105.3 mph exit velocity.
Conversely, several of Tatis’s hardest-hit balls still resulted in low-yield outcomes, including hard-hit ground balls and center-field redistribution from locations normally associated with pull-side loft and forward-launch damage.
Through 40 games:
- 0 pulled extra-base hits from the power band.
- 0 home runs.
For a hitter maintaining elite hard-hit rates and elite average exit velocity, that distribution is extraordinarily abnormal. The issue is not diminished physical capability. The issue is where the swing decisions are being deployed and what those decisions are producing. In leverage counts, where elite power hitters typically concentrate aggression inside the power band to maximize pull-side loft and home-run conversion, Tatis repeatedly attacks locations generating elevated whiff totals, repeated hard-hit outs, and suppressed airborne damage conversion. The approach data suggests the problem begins before collision ever occurs.
Reduced Swing Arc
Why are pitches on the inner half of the plate, where spray affordance is naturally constrained by collision geometry, being driven into the ground pull-side or conserved toward center field and the opposite field with low launch angles despite elite exit velocity? The data points to a single mechanical cause: the use of a conserved swing arc.
A conserved arc functions as a swing-quickening interception strategy. Preserving the same spray angle while meeting a 97-mph pitch 8 inches deeper requires the hitter to bring the barrel into the zone earlier while reducing the circumference of the swing arc. On a 97-mph pitch averaging 93.14 mph over 54 feet, the deeper contact point only provides about 5 milliseconds of additional time, illustrating that the primary change is not meaningful reaction-time gain, but a shortened arc that creates earlier zone coverage while securing a deeper interception window without meaningful gain in pitch recognition or decision time.
Likewise, the swing-time reduction produced by the conserved arc is fractional. Conserved arc swings are indeed quicker, but not meaningfully so for hitters who already produce elite bat speed and a proven historical ability to handle high-velocity pitching. The fact that Tatis continues to produce elite hard-hit rates and average exit velocities under this geometry strongly suggests the conserved arc itself is unnecessary for successful interception.
Pitches are being contacted unusually deep relative to their damage potential, forcing the barrel into a steeper collision orientation (VBA) as swing space narrows. The result is elite force production paired with suppressed launch plus reduced pull-side lift. And for Tatis, the geometric penalty is severe. “Contacting the ball this deep reduces the available spatial window for forward barrel propagation, often requiring steeper collision orientations to preserve interception and collision alignment. The collision becomes choked off before the barrel can fully extend through the zone, preventing forward launch.
(Pitching) Strategies for Staying Ahead of the Adjustment Curve
Through the first 40 games of the 2026 season, pitchers have identified the low-hanging fruit against Fernando Tatis Jr. by attacking low and away early in counts, and the data suggests that approach should continue. Tatis repeatedly cooperates with the strategy through aggressive early-count engagement in lower outer-half regions. In those locations, his swing often does broaden, but that expansion occurs in geometrically weaker damage regions where lofted pull-side conversion potential is naturally reduced. The result favors the pitcher: strong contact can still occur, but damage conversion remains inefficient, swing-and-miss increases, and more plate appearances move toward pitcher leverage.
- Outside-knees pitches with one or fewer strikes: 18 swings, 6 whiffs, 10 balls in play, 5 hard-hit balls, 0 extra-base hits, 85.7 mph average exit velocity, -14.8° average launch angle, -5.9° average spray angle
- Lower outer-half pitches from thighs-to-knees with one or fewer strikes: 41 swings, 9 whiffs, 22 balls in play, 12 hard-hit balls, -7.0° average launch angle, 7° average spray angle
The contrast appears inside the primary damage corridor, from the thighs to the numbers and from middle-inside through middle-outside. This is where a broadened swing circumference should produce the greatest damage value, yet the swing repeatedly remains conserved in circumference too deep into collision space. The average spray angle contracts to 5.3°, compared with 7.0° in the lower outer-half regions, showing that the swing is broadening in lower-yield outer-half regions while remaining geometrically conserved inside the primary damage corridor where forward-launch propagation should be greatest.
Pitches from the thighs to the numbers and from middle-inside through middle-outside with one or fewer strikes:
- 51 swings, 21 hard-hit balls, only 1 extra-base hit, 5.3° average spray angle
The strategic implication is direct. Pitchers should continue feeding the lower outer-half attack pattern until Tatis proves he can consistently broaden the swing arc inside the primary damage corridor rather than outside of it. The current pattern allows his force to survive in lower-yield regions while suppressing the damage conversion that would normally come from efficient forward propagation in the primary damage corridor.
If Tatis begins adjusting to the predictable low-away pattern, the next pressure point is likely inside belt-high velocity. Across 169 total two-strike pitches in the 40-game sample, pitchers threw only four fastballs or sinkers to inside belt-high or inside numbers-high locations combined, just 2.4%. Those locations remove much of the vertical affordance currently allowing steepened VBA compensation to preserve collision lower in the zone. Selectively reclaiming that lane may become the next way to stay ahead of his adjustment path.
- Inside belt-high or inside numbers-high fastballs/sinkers in two-strike counts: 4 of 169 pitches, 2.4%
- Results: 1 foul ball, 1 swinging strike on sinkers; 1 foul ball, 1 swinging strike on four-seam fastballs
Conclusions
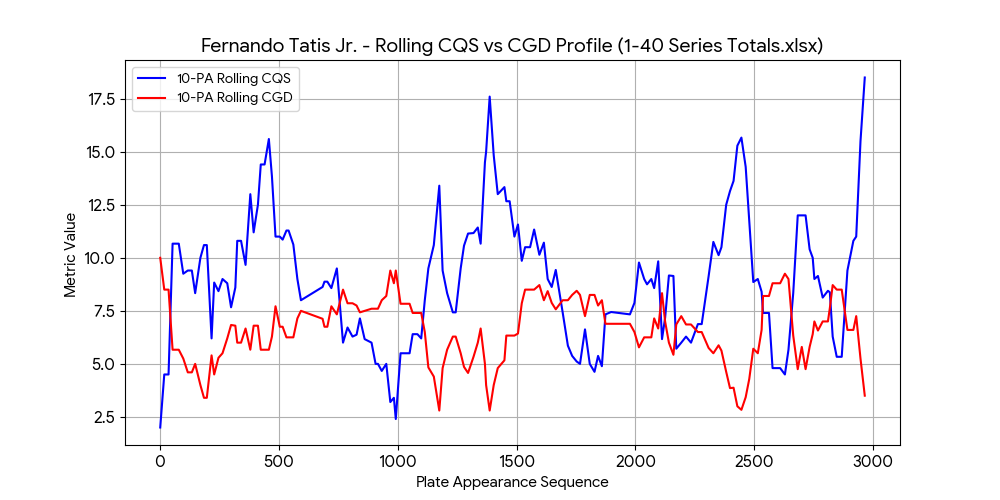
With 40 games of data, we are seeing a coherent, repeating behavioral structure rather than scattered early-season noise. This is what the data calls a causal agreement loop. Multiple independent variables are reinforcing the same interpretation: aggressive lower-zone engagement leads to reduced pull-side expansion, which causes the hard-hit redistribution toward center field and right-center field. This cross-layer agreement shows Tatis is caught in a cycle, repeatedly selecting and producing the same self-defeating collision environments. The first 40 games provide enough structural stability to establish the likely trajectory of the remainder of his 2026 season.
The persistence of the pattern across rolling 10-game clusters strengthens the conclusion. If this were random variance or temporary early-season noise, we would expect to see at least intermittent fluctuations in approach and outcomes. In other player evaluations, even struggling hitters typically show temporary drift in swing allocation, pull-side damage conversion, spray distribution, or leverage-count selectivity across smaller rolling samples. Tatis’s data does not show those fluctuations. The same leverage-count aggression toward lower-zone and outer-half locations continues to repeat across all four 10-game clusters. The same lower-zone and outer-half regions continue producing elevated whiff totals, elevated strikeout totals, hard-hit outs, center-field and opposite-field spray conservation, and suppressed pull-side damage. At the same time, the force production remains consistently elite throughout the sample. The engine never disappears. The damage conversion seldom arrives.
The collision behavior itself also remains structurally consistent, but not uniformly so. On inside and middle-inside pitches, 72.5% of contacted balls were redistributed toward center field or the opposite field, reinforcing the repeated conservation of collision geometry within the primary damage corridor. Outside pitches showed a different form of geometric conflict. Rather than conserving deeper, 62.1% of contacted outside pitches were redirected toward pull-side or middle-field space, producing spray behavior inconsistent with the commensurate geometry normally associated with outer-half pitch locations. The result is not a single repeating spray pattern, but a stable repetition of distinct collision-geometry conflicts tied to pitch location.
That stability across independent rolling windows strongly suggests the profile is structural rather than random. Early-season environments normally produce elevated behavioral variance as hitters recalibrate swing decisions, timing behavior, and approach allocation while pitchers simultaneously adjust sequencing and attack patterns. Under those conditions, collision distributions would typically appear noisier and less stable across rolling samples, particularly through only one quarter of a season. Instead, Tatis’s profile continues showing unusually persistent cross-layer agreement. The same leverage-count aggression, spray conservation, launch suppression, and collision-geometry redistribution continue repeating despite an environment that should naturally produce greater fluctuation. Rather than weakening the structural interpretation, the early-season environment strengthens it.
To recover his power, Tatis must shift his contact depth forward to restore a broadened swing arc within the power band. He must also stop attacking low-and-away zones early in the count. Until those adjustments occur, his aggregate force metrics will continue masking a severe degradation in launch geometry and damage conversion. Tatis has not lost his physical force. He has lost the efficient conversion of that force into damage. Until the arc changes, the slump remains permanent.