Neutralizing Effective Velocity in Baseball Batting

By Ken Cherryhomes

Have you heard of Effective velocity (Ev)? The Effective velocity theory by Perry Husband contends the same velocity pitch can appear to be faster or slower based on the location relative to the batter. A pitch thrown up-and-inside appears to be faster than the same velocity pitch located low-and-away.

This is described by Perry Husband as “the study of pitch speed and how location changes the reaction time by forcing the hitter to hit the ball at a contact point that is different than they were ready for. When a pitch at 90 MPH is inside or outside, the speed “Effectively” changes because the hitter has to hit the ball earlier or later as though the pitch gained or lost speed. So, in essence, the pitch location has caused the hitter to gain or lose reaction time. For every 6″ inches that the ball changes laterally, there is a little less than 3MPH gained or lost.”

It’s not possible to quantify an individual’s perception, but I understand what he’s driving at. In reality, when comparing contact points to each other, the difficulty resides in the affordance of swing space relative to pitch location. And while yes, the difference in contact depth is different between the inside and outside pitches, the actual difference in velocity is negligible, almost indistinguishable.

Avg velocity of a pitch released at 90mph. The inside pitch at the letters avg velocity is 86.15mph, while the avg velocity of the same pitch outside at the knees is 86.01mph

Below is a 2D graph showing all 25 contact points in the strike zone. This illustration depicts the strike zone as we see it in most telecasts, superimposed above the plate, but instead of quadrants or zones, broken down into 25 different strikes within the strike zone.

Let’s assume, as Perry does, a swing in which we follow the arc of the sweet spot of the barrel, the point where 100% on time contact occurs, as it travels through the strike zone from out to in. This will result in the sweet spot arriving in the hitting zone at different depths as the barrel arcs along its path.

One swing path/3 contact points along the bat's arc

This switches our view of the strike zone from the two-dimensional grid to a three-dimensional Cartesian coordinate matrix, where the X coordinate represents the horizontal plane, the Y coordinate represents the vertical plane, and the Z coordinate represents depth.

Now we can observe the strike zone and all 25 strikes while tracking the sweet spot of the barrel as it arcs through the zone. When the sweet spot of the bat arrives at any of the 25-strike zone contact points, a measurement was taken, relative to the front edge of home plate.

(0" represents the front edge of home plate. All other measurements are +/- from 0")

Here are all 25 contact points in a 3D scale model.

I recognize the difficulty of different pitch locations not so much by reaction time differences, which are actually quite small when measured but still play a key role in making timing decisions difficult, but more so the space afforded by the pitch location, as I mentioned earlier. The inside pitch gives us the impression it requires a tight swing radius, while the outside pitch offers a broader space to swing in. However, if we consider swinging in a forward linear path, the same swing path allows for the same swing space in the horizontal plane (in to out) but with different contact depths, as I’ve shown. By swinging in a forward direction, the batter’s hands start inside the ball and remain inside the ball, even on an inside pitch.

Reactionary Quickness

So how do we mitigate this pitcher deception? Again, despite the truly negligible difference in final velocity between the inside, outside and middle pitches, due to the fractions of seconds separating reaction times between these pitch locations results in a lot of mis-hit baseballs.

Husband performed a test in the early 2000s demonstrating how, by throwing the same pitch but to different locations, he was able to deceive elite high school batters enough to limit them to a .187 hard-hit rate.

From an article on Perry Husband's Liquid Analytics

His demonstration illustrates how important it is to understand and practice contact points and depth of contact by viewing the strike zone in three dimensions rather than two, and how fractions of seconds in decision time make all the difference- far beyond swing mechanics.

Mitigating Effective Velocity

My understanding of contact points, depth of contact and timing has always been the core of my hitter training. Eventually, I was able to create technologies that could solve this effective velocity deception and set out to prove this.

First, I captured an average community college freshman’s swing time, his Time to Impact (TTI) for a pitch over the middle of the plate. This time measurement is comprised of his swing time, from launch to contact, as well as his reaction time and any potential lag that would delay the forward launch of his bat. Once I arrived at an average swing time to that location for this hitter, I applied that capture to an algorithm that populates his swing times to all 25 pitch locations.

Next, using a programable pitching machine set at 90mph, unbeknownst to the hitter, I sequenced four pitches, two inside at the thighs, one outside at the thighs, and one middle at the thighs. This testing session falls in line with Perry Husband’s Ev experiment in the early 2000s where he randomly moved pitches of the same velocity around the strike zone to throw off the batter’s timing or “hitter’s attention”, as he calls it. I intentionally sequenced the pitches to begin with two inside pitches, since this location affords the least time and swing space, setting the hitter’s attention on this timing.

Pitches captured in real time and the swing times of the batter corresponding with the pitch locations sequenced.

I then used a pitch capture device to determine the pitch velocity of each pitch, applied an algorithm to those captures that correlated them with the hitter’s TTI measurements to each pitch location. At the precise moment the batter needed to initiate his swing, a signal was issued, a “go” message, instructing the hitter to start swinging.

Using your volume control when watching this video of our testing, you will hear a distinct audio tone issued to the batter. He had no idea what location the pitches were going to arrive at, he just responded to the go signal with the same swing, precisely timed relative to the pitch locations.

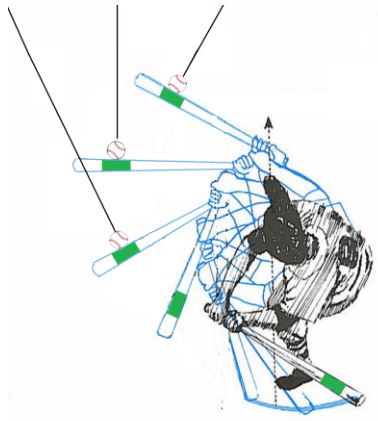
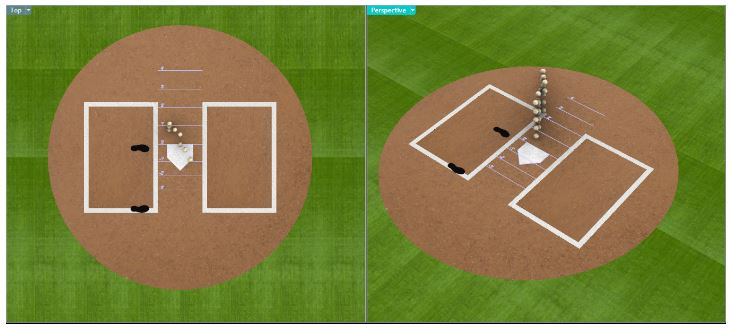
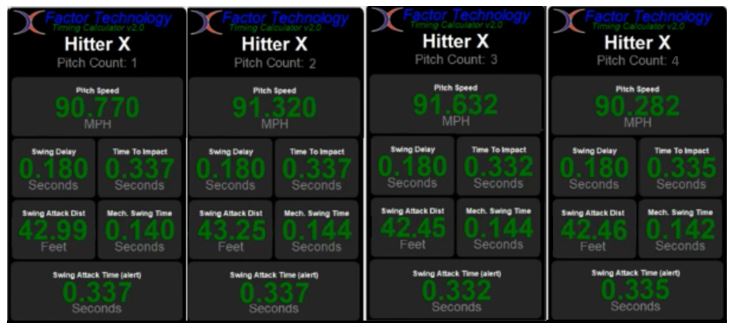
Note: this video of the testing is unedited to prove no cherry picking of swings, just four perfectly timed swings confounding the effective velocity challenge.

I have highlighted the contact points at the end of the testing video. I also took three of the swings and sewed them together to illustrate that while they are three separate swings, they appear as one arcing swing colliding with three different pitches as the barrel follows along the same arc.

Through technology, a hitter can practice combating effective velocity sequencing with precision, a much more difficult task without it. Our hitter was four for four in hard hit ball rate during our testing, as compared to the .187 rate Perry experienced in his testing of Ev.

For more on the xFactor Hitting System and how we aim to improve hitters through errorless training for accelerated memory encoding and consolidation, reach out to us with any questions you may have or if you are interested in collaborating with us on our research study you can read about here: Research proposal

Please send questions and comments to:

[email protected]

@XFactorTechn